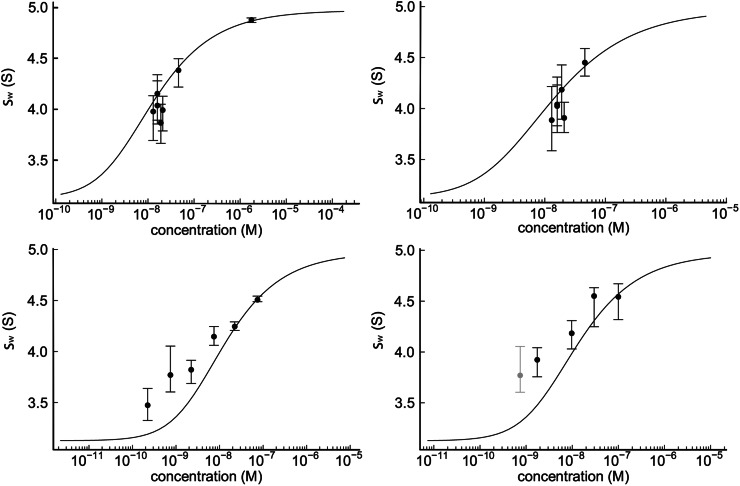
Figure S2.
Global fit of the data shown in Fig. 3 D, consisting of the absorbance data at 230 nm (top left) and at 210 nm (top right) of GluA2S-EndoH, and the FDS-detected dilution series of FAM-labeled GluA2S-EndoH of the same preparation (bottom left) and its titration series with unlabeled material (bottom right). (A light gray data point at the lowest concentration of the titration series indicates the starting point of the titration and is identical to the second data point of the dilution series; it was excluded from the fit to avoid duplication.) The global fit was performed with a hydrodynamic constraint for the monomer s-value to be in the interval from 2.9 to 3.3 S, resulting in a K d of 12 nM (95% CI; 5.4–20 nM), although clearly the fit is of poor quality.

