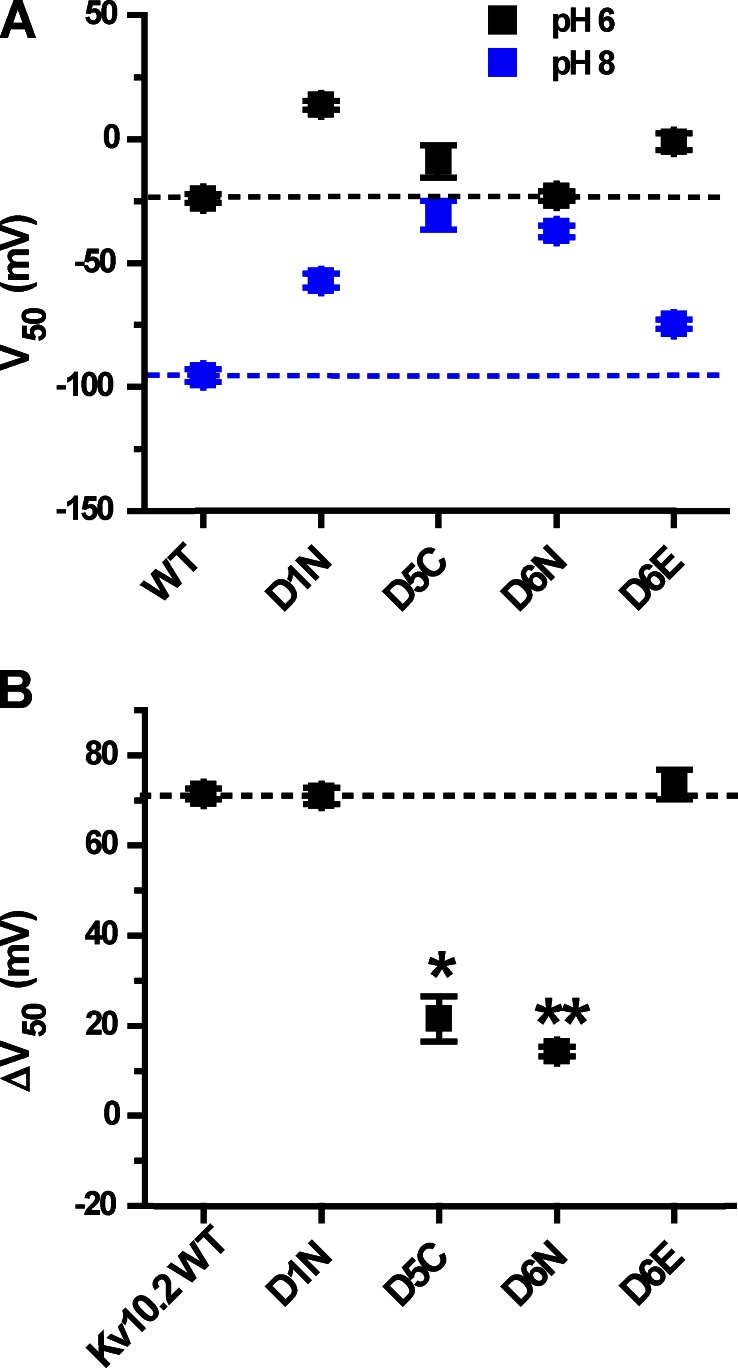
Figure 10.
Shifts in V50 caused by the change of external pH from 8 to 6 for Kv10.2 mutants. (A) V50 values are shown for pH 6 and 8 for mouse Kv10.2 channel and its mutants; dashed lines are extended across the figure to indicate the WT values. V50 values were obtained from Boltzmann fits shown in Fig. 9 (C–G). (B) ΔV50 (pH 8 to 6) plots for Kv10.2 WT and S2/S3 acidic residue mutants. Significance was tested with a two-tailed nonequal variance Student’s t test; asterisks indicate significant difference with respect to WT: **, P < 0.001; and *, P < 0.005. The dashed line indicates the value of ΔV50 (pH 8 to 6) for WT Kv10.2.

