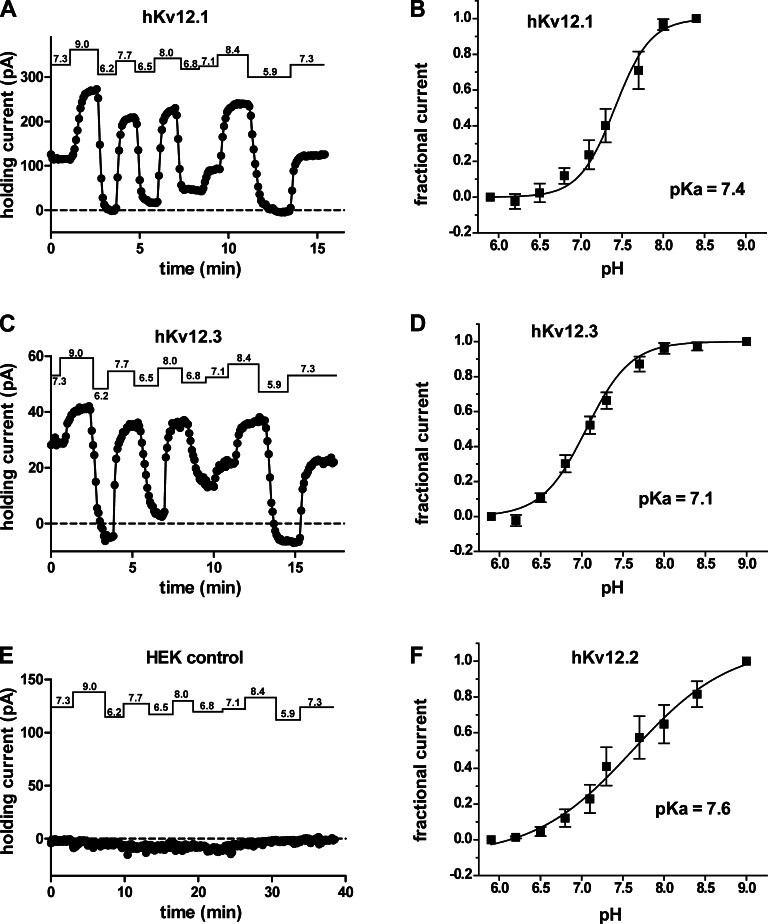
Figure 4.
Effect of bath pH changes on holding current in HEK293 cells expressing Elk channels. (A and C) Holding current versus time plots are shown for whole cell patch recordings of HEK293 cells expressing human Kv12.1 channel (A) and Kv12.3 channel (C) during a series of bath pH changes (values indicated above). Data points were taken every 5 s. A typical recording from an untransfected control cell is shown in E. (B, D, and F) Plots of holding current versus pH are given for human Kv12.1 (B), Kv12.3 (D), and Kv12.2 (F) channels. Data from individual cells were normalized to the magnitude of the holding current obtained at the highest and lowest bath pH values examined. Data points show mean ± SEM (n = 4–6), and curves show a four parameter dose–response fit with the predicted pKa value indicated.

