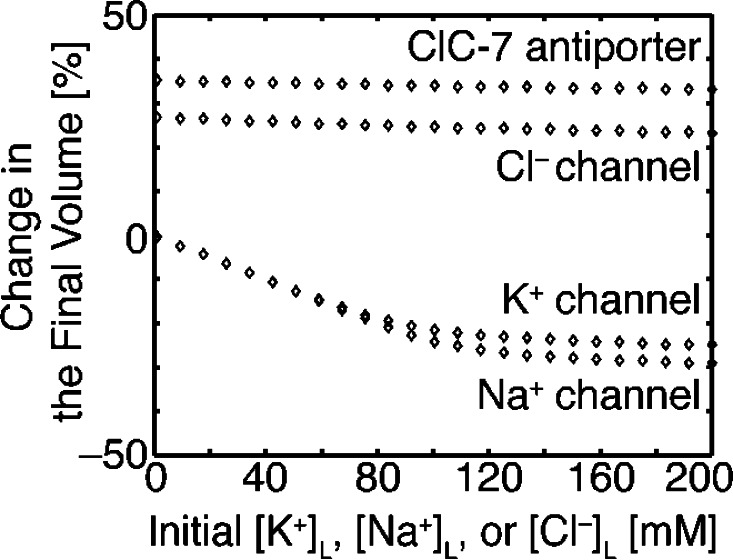
Figure 6.
Different counterion pathways have different effects on lysosomal volume. The simulations reported are identical to those shown in Fig. 4 A except for the initial lysosomal volume and the inclusion of water flux. For each counterion pathway, the initial concentration of the ion being transported was varied from 1 to 200 mM, and the percentage change in the steady-state volume relative to the initial volume was calculated. The initial volume and surface area were set to 3.3 × 10⁻¹⁷ L and 6.2 × 10⁻⁹ cm2, respectively. The lysosome with ClC-7 resulted in the greatest increase in volume as it acidifies, and the final volume was close to the volume of the sphere with the same surface area as the initial value.

