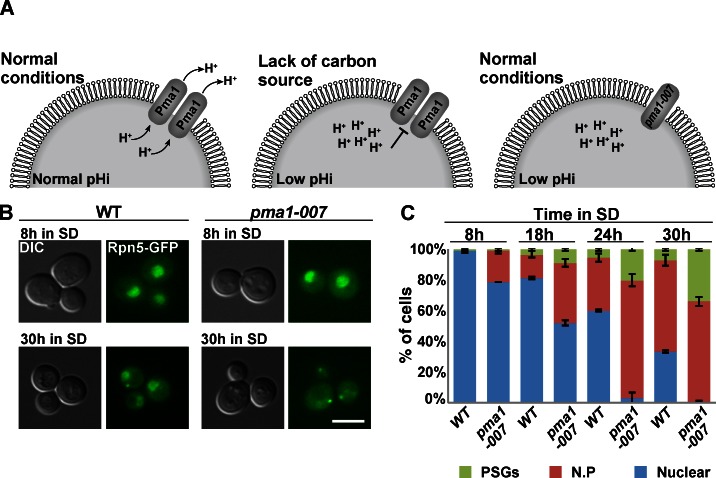
Figure 4.
Impaired capacity to pump protons out of cells affects the kinetics of PSG formation. (A) Schematic illustration of PMA1 regulation. (B) pma1-007 and wt cells were grown in SD for 30 h. Cells were visualized by DIC and GFP at the indicated time points. The representative images shown at t = 30 h show the PSG localization pattern that was significantly enriched in pma1-007 mutants, comparing with the nuclear localization pattern that still appeared in wt cells. Bar, 5 µm. (C) Cells were visualized by DIC and GFP at the indicated time points. The localization of Rpn5-GFP was scored as described in Fig. 2. Error bars show the standard deviation between two independent experiments. N.P, nuclear periphery.

