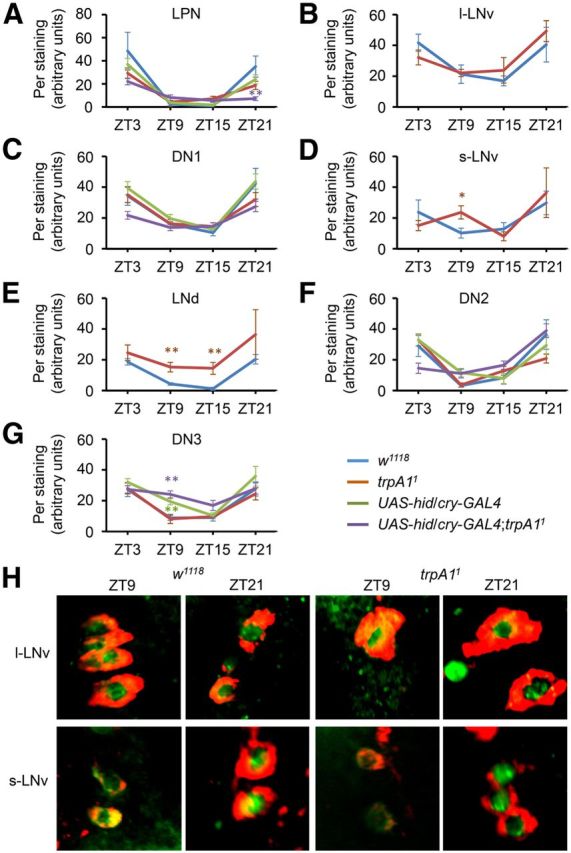
Figure 3.

Quantification of Per oscillations in clock neurons. Three- to 7-d-old flies were entrained under a TC cycle (29°/18°C) for 5 d. The brains were then dissected at ZT3, ZT9, ZT15, or ZT21 and stained with anti-Per. A–G, The genotypes and the types of pacemaker neurons are indicated. Data are not indicated for Per levels in l-LNvs, s-LNvs, and LNds since these pacemaker neurons are eliminated in UAS-hid/cry-GAL4;trpA11 (Busza et al., 2007). We confirmed this finding by immunostaining with anti-Per and anti-PDF (data not shown), the latter of which labels only l-LNvs and s-LNvs in wild-type (Renn et al., 1999). The fluorescence intensities were quantified using MacBiophotonics ImageJ software using 3D reconstruction images (10–27 brain hemispheres per sample). The formula for the relative intensity (I) is I = 100(S − B)/B, where S is the fluorescence intensity and B is the background intensity of the region adjacent to the pacemaker neuron (Picot et al., 2009). The error bars indicate SEM. The asterisks indicate significant differences from wild-type (*p < 0.05, **p < 0.01) based on ANOVA and the Scheffé post hoc tests. H, Colabeling with anti-Per (green) and anti-PDF (red) from w1118 and trpA11 l-LNvs, and s-LNvs at ZT9 and ZT21.
