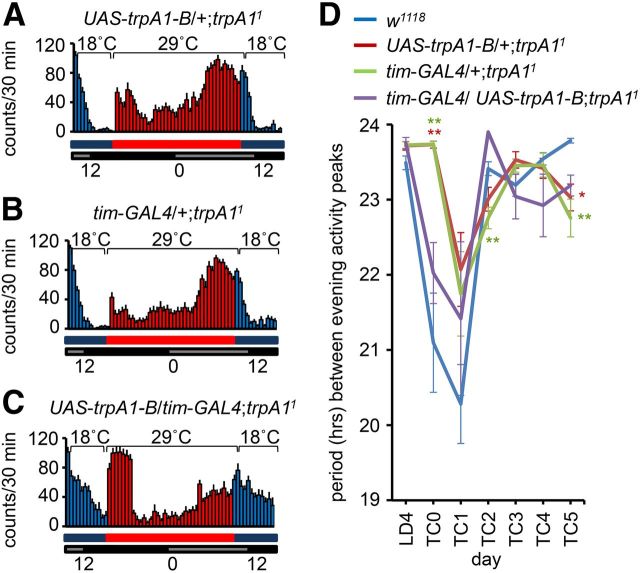
Figure 7.
Suppression of the trpA1 phenotype by expression of the trpA1-B isoform in pacemaker neurons. Flies were maintained and entrained using the same paradigm as in Figure 1D–K. A–C, Average activities of male flies on TC day 3 (overall day 7) for the indicated genotypes. D, Periods between evening activity peaks from LD4 to TC5. The error bars represent SEMs. The asterisks indicate significant differences from wild-type (*p < 0.05, **p < 0.01) based on ANOVA and the Scheffé post hoc test.

