
Figure 1.
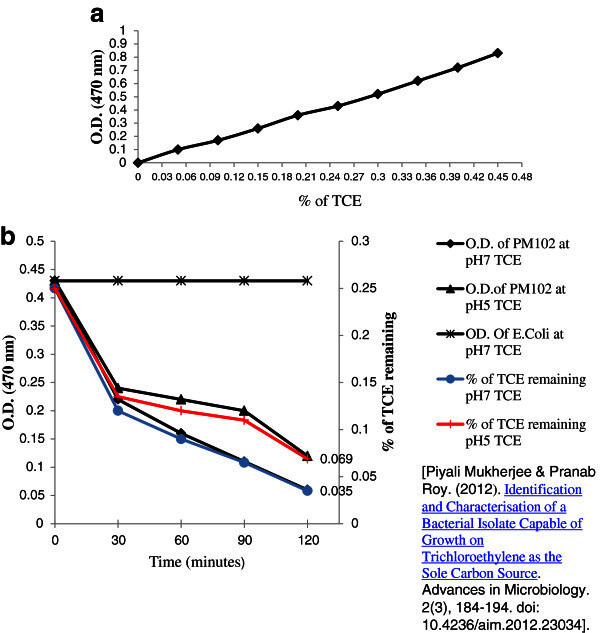
Fujiwara test to confirm TCE degradation by the PM102 isolate.a. Standard curve of% of TCE plotted against absorbance. b. Plot showing the decrease in absorbance corresponding to the catabolism of 0.3% TCE added initially, by PM102, measured at pH 5 and pH 7 respectively. Secondary vertical axis shows the% of TCE remaining at different time intervals as calculated from the standard curve.