Figure 3.
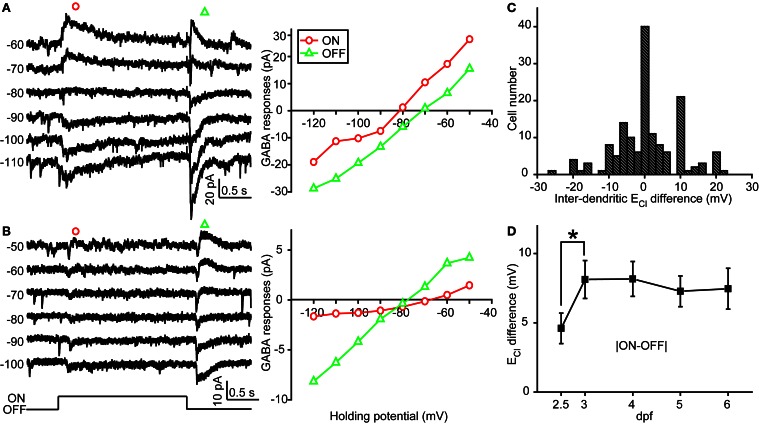
Inter-dendritic ECl difference between ON and OFF dendrites of zebrafish ON-OFF RGCs. (A,B) Left, light-evoked ON and OFF synaptic responses recorded at different holding potentials from two ON-OFF RGCs under gramicidin-perforated patch recording mode. Right, I–V curves of the late-phase components of light-evoked ON (red circle) and OFF (green triangle) responses. (C) Distribution of the inter-dendritic ECl difference from 152 cells. (D) Mean absolute values of inter-dendritic ECl difference from 2.5 to 6 dpf. At each data points, the cell number is more than 15. *P < 0.05, unpaired Student's t-test. The values are represented as mean ± SEM.

