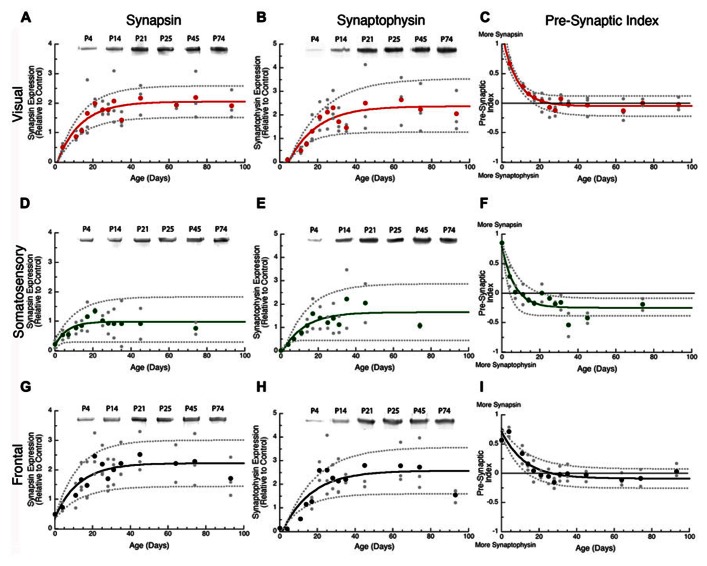
FIGURE 2.
Developmental changes in synapsin (A,D,G), synaptophysin (B,E,H), and the pre-synaptic index (C,F,I) in rat visual (red), somatosensory (green) and frontal (black) cortex. Gray dots are results from all runs, and color dots are the average for each animal. Example bands for each protein and area are shown above the graphs. Exponential decay functions were fit (solid lines), and 95% confidence intervals (dotted lines) were added, adult levels are defined a 3τ. Synapsin reached adult levels in visual (A) at P37 (3τ = P37.2 ± 12.6; curve-fit R = 0.70; p < 0.0001), somatosensory (D) at P19 (3τ = P19.0 ± 14.9; curve-fit R = 0.45; p < 0.005), and frontal (G) at P38 (3τ = P37.6 ± 13.5; curve-fit R = 0.70; p < 0.0001). Synaptophysin reached adult levels in visual (B) at P45 (3τ = P44.8 ± 15.1; curve-fit R = 0.72; p < 0.0001), somatosensory (E) at P35 (3τ = P34.7 ± 22.2; curve-fit R = 0.64; p < 0.0001), and frontal (H) at P45 (3τ = P45.4 ± 14.2; curve-fit R = 0.75; p < 0.0001). Pre-synaptic index reached adult levels in visual (C) at P24 (3τ = P23.5 ± 4.2; curve-fit R = 0.88; p < 0.0001), somatosensory (F) at P20 (3τ = P20.2 ± 6.0; curve-fit R = 0.82; p < 0.0001), and frontal (I) at P37 (3τ = P36.8 ± 7.8; curve-fit R = 0.85; p < 0.0001).

