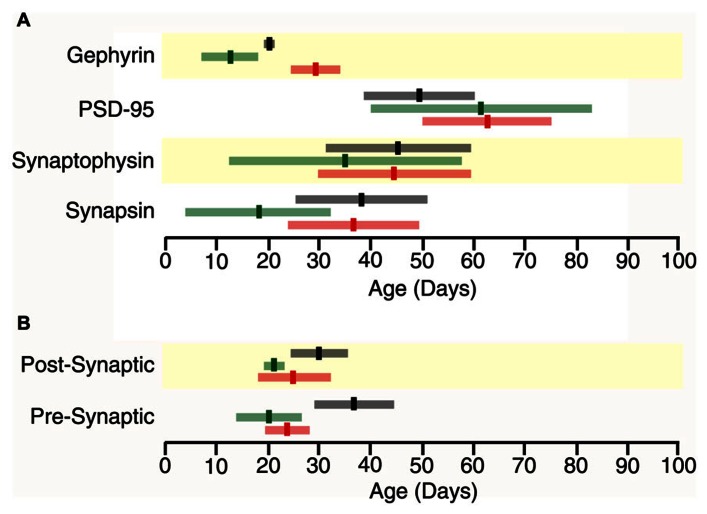
FIGURE 4.
Time lines for maturation of protein expression and pre- and post-synaptic indices in frontal (black), somatosensory (green) and visual cortex (red) showing the age when adult levels (3τ) or peak in expression were reached (bright bars) and the standard error (light bars) around the 3τs or peak (light bars) (A) Adult levels of synapsin expression overlapped among the three cortical areas (Visual, 3τ = P37.2 ± 12.6; somatosensory cortex, 3τ = P19.0 ± 14.9; Frontal, 3τ = P37.6 ± 13.5). Adult levels of synaptophysin expression overlapped among the three cortical areas (Visual, 3τ = P44.8 ± 15.1; somatosensory, 3τ = P34.7 ± 22.2; Frontal, 3τ = P45.4 ± 14.2). Adult levels of PSD-95 expression overlapped among the three cortical areas (Visual, 3τ = 61.9 ± 12.3; somatosensory, 3τ = 61.2 ± 21.4; Frontal, 3τ = 49.1 ± 11.8). Peak in gephyrin expression was significantly later in Visual (Peak = 29.3 ± 5.1), than somatosensory (Peak = 12.8 ± 5.1, p < 0.05) and Frontal (Peak = 20.4 ± 1.1, p < 0.05) cortex. (B) The pre-synaptic index reached adult levels earlier in the sensory areas (Visual, 3τ = P23.5 ± 4.2, p = 0.06; somatosensory, 3τ = P20.2 ± 6.0, p < 0.05) than in frontal cortex (3τ = P36.7 ± 7.8). The post-synaptic index reached adult levels earlier in the sensory areas (Visual, 3τ = 46.4 ± 9.5, p < 0.05; somatosensory, 3τ = 43.5 ± 6.1, p < 0.005) than in frontal cortex (3τ = 75.6 ± 11.2).

