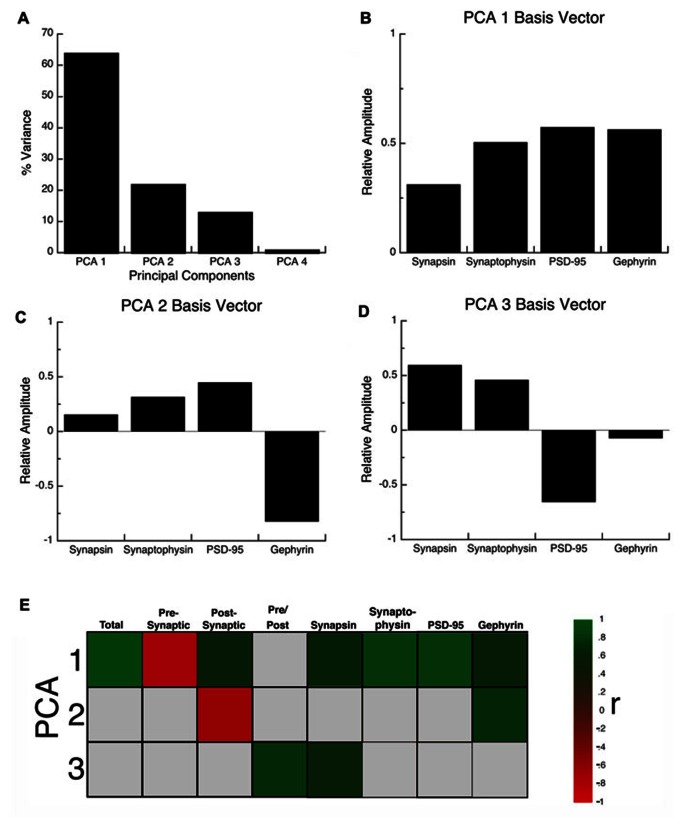
FIGURE 5.
Principal component analysis. (A) The percent variance captured by each component of the SVD analysis of protein expression in rat visual, somatosensory, and frontal cortex. The first three principal components represent the significant portion (99%) of the SVD. (B–D) The influence of each protein on the three principal components was reflected by the relative amplitude in the basis vectors. (E) Significant correlations (colored cells) between the three principal components and the combinations of proteins derived from the basis vectors. The color indicates the magnitude (represented by color intensity) and direction (green indicates positive, red indicates negative) of significant correlations (Bonferroni corrected, p < 0.0024).

