
Figure A2.
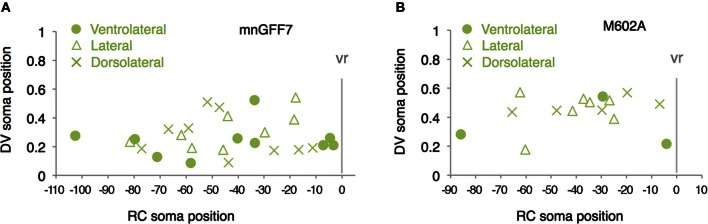
Distribution of the laterally projecting cells in mnGFF7 (A) and M602A (B) plotted with respect to the soma position along the RC axis on the horizontal axis and to the DV soma position on the vertical axis. The exit point of the ventral root from the spinal cord is indicated on the RC axis by the gray vertical line marked as vr (x = 0). The ventrolaterally, laterally and dorsolaterally projecting cells are shown as circles, triangles, and crosses, respectively.