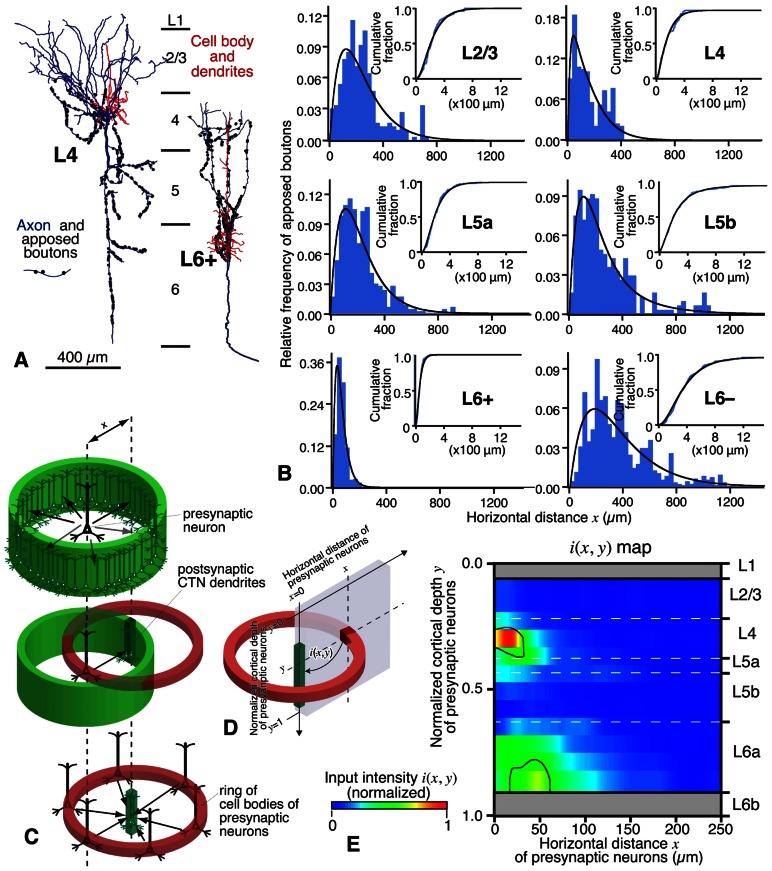
FIGURE 9.
Local excitatory inputs to VP-projecting CTNs in rat areas S1, HL, and FL. (A) Single L4 star-pyramidal and L6+ pyramidal neurons sent many apposed boutons to CTNs. (B) The horizontal distribution (fitted with a gamma distribution) of the apposed boutons of representative neurons were different from layer to layer. L4 spiny and L6+ pyramidal neurons sent apposed boutons to CTN dendrites that were located in a narrow range, whereas L5 and L6– neurons projected them to CTN dendrites that spread horizontally. (C,D) From the original data in (B), the number of apposed boutons arising from an average presynaptic neuron as a function of horizontal distance x is obtained (C, top) under the assumption that cortical excitatory neurons sending axons to CTN dendrites are distributed homogeneously in horizontal directions at a given depth (y). When the presynaptic neuron sends a certain amount of apposed boutons to postsynaptic CTN dendrites in a given unit volume (slender dense green square prism in C, middle), the CTN dendrites are expected to receive the same amount of projections from each neuron located in all directions at the same distance from them (C, bottom). Therefore, as shown in (D), a section can be cut out to make a two-dimensional input map; in other words, one can obtain input intensity map i(x, y), which is the density of axon boutons derived from presynaptic neurons within a red cube located at horizontal distance x and normalized cortical depth y and closely apposed to the postsynaptic CTN dendrites within the green square prism. In this estimate, the number of neurons in the cube located at (x, y) is calculated from the density of presynaptic VGluT1 mRNA-expressing neurons at depth y. (E) Input intensity map i(x, y). From the viewpoint of CTN dendrites in a unit prism, L4 spiny neurons are the most abundant source of local excitatory inputs. The regions encircled by black borders in (E) show significantly high i(x, y) (> mean + 2SD). For more detail, see Tanaka et al. (2011b). Modified with permission from Figures 5–8 of Tanaka et al. (2011b).

