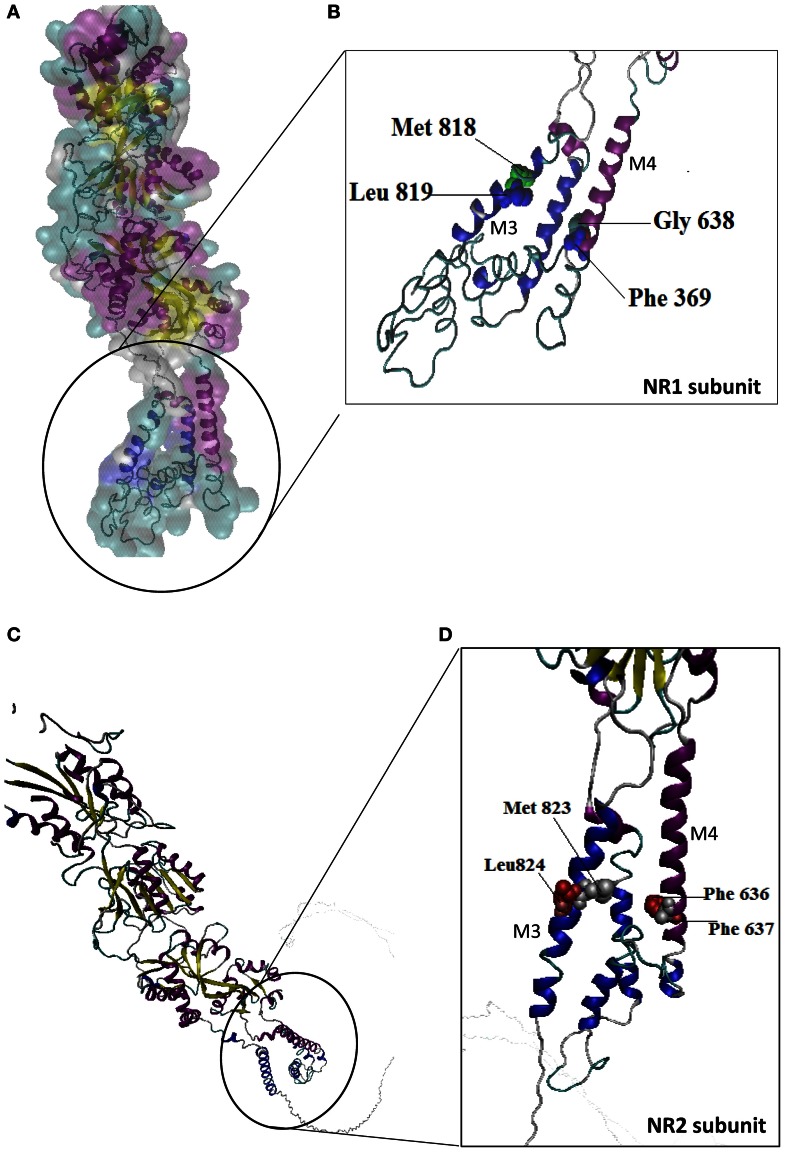
Figure 6.
Molecular structure of the NR1/NR2 subunit pairs shows a continuous molecular view. A model of the mouse NR1/NR2 subunit was derived by homology modeling and is depicted as a stereo view transparent grid surface ribbon model (A,C). Position in NR1 subunit was highlighted green (Met818, Leu819) and blue (Gly638, Phe639) residue are possible binding region of M3 and M4 domain. (B) Position in NR2 subunit M3, M4 domain interact with ethanol sensitivity are illustrated in red (Met823/Leu824) and silver color (Phe636/Phe637) binding site (D). NR1 (Accession no. NM_01177657.1) and NR2 (Accession No. NM_008170.2) subunit 3D structure prediction by using PHYRE2 automatic (http://www.sbg.bio.ic.ac.uk/phyre2) server. Ethanol binding active residues marked according to Ren et al. (2012) by using PyMol program (www.pymol.org).

