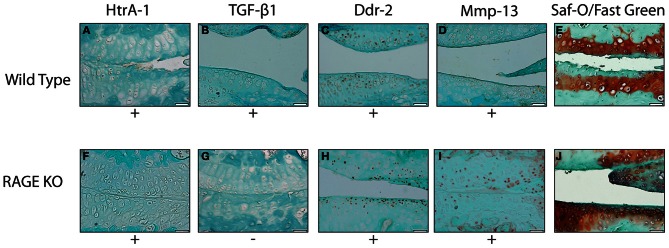
Figure 2.

Representative images showing the results of the immunohistochemical and histological stainings performed to analyze the presence of OA biomarkers and cartilage degradation. All tissue samples were harvested 28 days after the DMM surgery. The images selected are representative of the trends observed within wild type (A–E) (n = 5) and RAGE KO (F–J) (n = 6) samples. The wild type and RAGE KO samples demonstrated similar staining patterns in all biomarkers except TGF-β 1 where the RAGE KO samples demonstrated fewer samples which stained positive. The difference was not statistically significant when tested with a Chi-Squared test (p < 0.35). The scale bar, valid for every image, is 50 μm.
