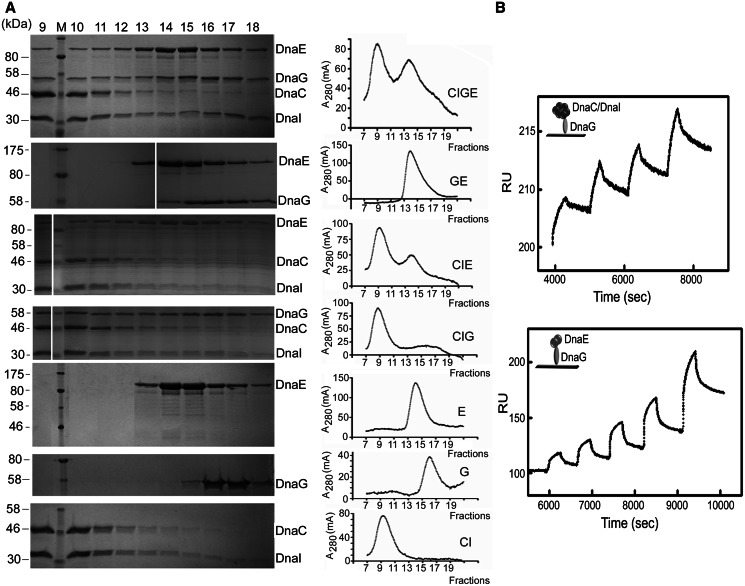
Figure 2.
DnaEBs, DnaC and DnaG form a ternary complex. (A) Gel filtration. Purified DnaC–DnaI, DnaEBs and DnaG proteins were mixed, incubated and then analysed for complex formation by gel filtration as described in ‘MATERIALS AND METHODS’ section. The composition of the mixture and the chromatograms obtained are indicated on the right. Column fractions 9–18 were analysed by SDS–PAGE stained by Coomassie Blue. Fraction numbers are indicated above the gels, protein names to the right and molecular weight of protein standards to the left. (B) SPR. Analysis of protein–protein interactions was carried out with immobilized DnaG and with DnaC/DnaI and DnaEBs in the mobile phase by single-cycle analysis with serial injections of increasing concentrations of DnaC/DnaI or DnaEBs, as described in ‘MATERIALS AND METHODS’ section. Control background data were subtracted from the experimental data, and the relevant sensograms are shown. Kinetic parameters were obtained using the BIAevaluation Software version 4.0. The derived parameters for the DnaG–DnaC/DnaI interaction were ka = 1.08 × 10³ M−1 s−1, T(ka) = 174, kd = 2.87 × 10⁻⁴ s−1, T(kd) = 44.5 [Rmax (RU) = 22.5, T(Rmax) = 317], Ka = 3.77 × 10⁶ (M−1), Kd = 2.95 × 10⁻⁷, (M) Chi2 = 1.62; and for the DnaG–DnaEBs interaction were ka = 2.4 × 10³ M−1 s−1, T(ka) = 33.2, kd = 1.81 × 10⁻³ s−1, T(kd) = 42.8 [Rmax (RU) = 88.8, T(Rmax) = 47.6], Ka = 1.33 × 10⁸ (M−1), Kd = 7.52 × 10⁻⁷, (M) Chi2 = 15.1.

