Figure 3.
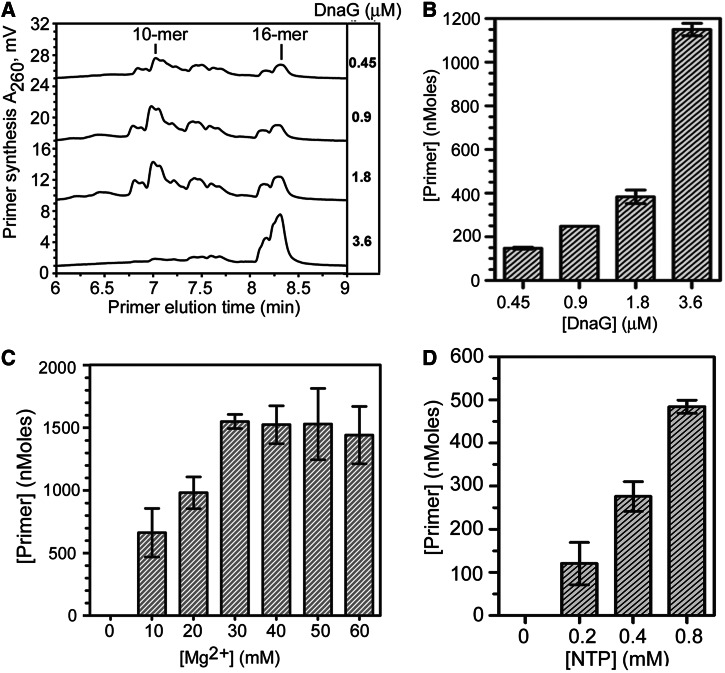
Characterization of the B. subtilis DnaG primase activity. (A) Representative chromatograms showing RNA primers synthesized by B. subtilis DnaG at the enzyme concentration indicated on the right. RNA polymers synthesized in the priming reactions with 2 µM trinucleotide-specific template containing the preferred 5′-d(CTA) initiation sequence and 0.4 mM each NTP were visualized by thermally denaturing HPLC. The lengths of the primers were determined by comparison with RNA standards. The 10-mer and 16-mer RNA polymers are denoted. (B) Bar graph showing B. subtilis DnaG concentration–dependent primer synthesis and total amount of RNA primers synthesized in the priming assays described and shown in panel A. (C) B. subtilis primase activity as a function of magnesium ion concentration. Shown are the relative levels of RNA primers synthesized by B. subtilis DnaG (1.8 µM) in reactions with the 23-mer 5′-d(CTA)-containing ssDNA template and the indicated concentration of magnesium acetate. (D) B. subtilis primase activity as a function of NTP concentration. Shown are the relative levels of RNA primers synthesized by B. subtilis DnaG (1.8 µM) in reactions with 2 µM of the 5′-d(CTA)-containing ssDNA template and the indicated concentration of each NTP.

