Figure 6.
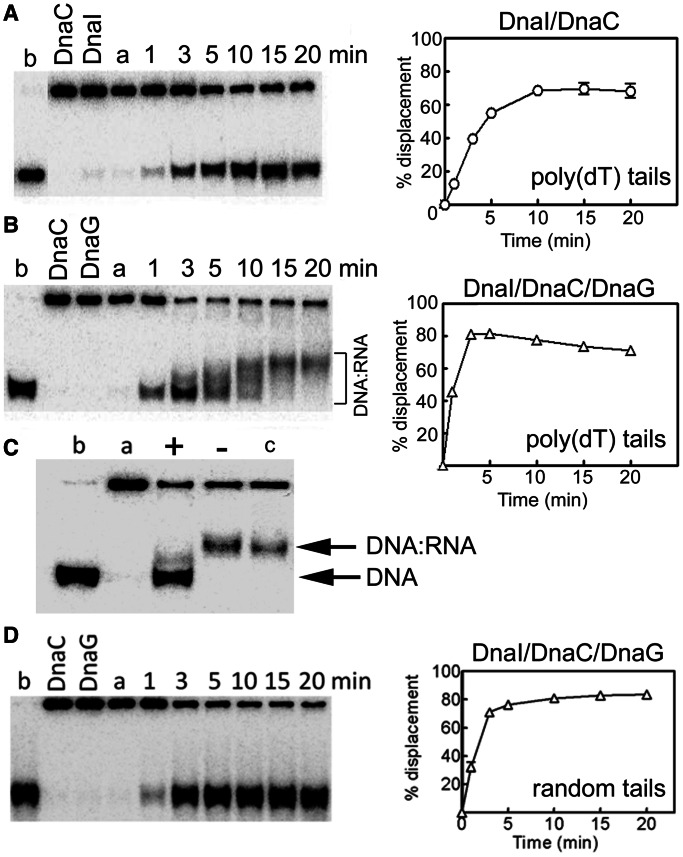
A reconstituted coupled helicase–primase assay. (A) The helicase activity of DnaC (500 nM) in the presence of DnaI (500 nM) is shown as a function of time. The DNA substrate used was a radiolabelled synthetic oligonucleotide annealed onto ssM13 DNA, producing a double-fork substrate with poly(dT) tails. (B) Helicase reactions were carried out exactly as in panel A but in the presence of DnaG (250 nM). Stimulation of the helicase activity (compare the graphs in panels A and B) as well as concomitant de novo RNA primer synthesis from multiple 5′-d(TTT) sites along the tails of the annealed oligonucleotide (shifted bands) can be clearly seen. (C) Helicase reactions (20 min) in the presence of DnaC/DnaI (500 nM each protein) and DnaG (250 nM) with the double-fork poly(dT) DNA substrate. After 20-min incubation at 37°C, the reaction products were incubated with RNase H (2 units, New England Biolabs) for 1 h at 37°C before addition of the stop buffer and further incubation at 37°C for 20 min, followed by electrophoresis. Lanes a and b represent annealed and boiled substrates, respectively. Lane c represents a standard 20-min helicase reaction. Lanes marked with + and − signs represent RNase H–treated and non-treated (RNase H storage buffer was added and the reaction was processed in a manner identical to the RNase H treated reaction) helicase reactions, respectively. (D) Identical helicase reactions as described in panel B were carried out with a radiolabelled oligonucleotide annealed onto ssM13, producing a double-fork substrate the tails of which had random sequences. No gel shifts were apparent, suggesting that no RNA primers were synthesized. In all helicase experiments, data from triplicate experiments were quantified and plotted as % displacement of the annealed oligonucleotide as a function of time. Experimental errors were within a ±5 range. Lanes labelled a and b represent annealed and fully displaced (boiled) controls, while control reactions with individual DnaC, DnaI and DnaG proteins are shown in the relevant lanes in panels A, B and D.

