
Figure 6.
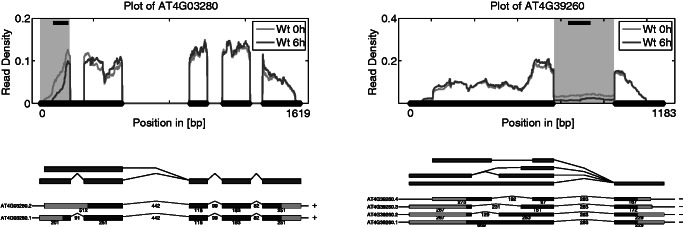
Examples of two genes detected by rDiff.nonparametric with a minimal P-value of 0.01. Shown is the read density on top. The gray area indicates the region in which the change was detected, and the black bar in the upper part of the plot shows the 100-bp region which showed the biggest difference. Below the read densities is the splice graph in dark gray and the transcripts in black. The light gray indicates the UTRs.