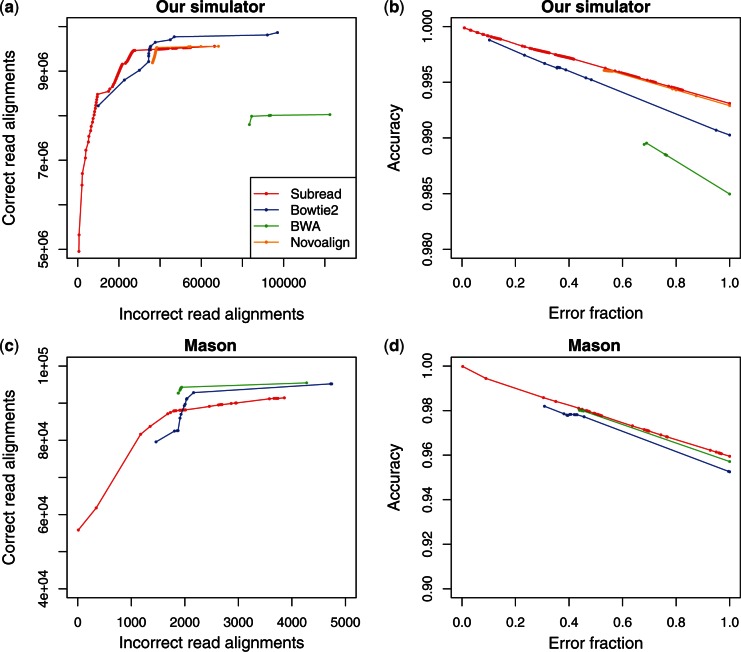
Figure 4.
Recall and accuracy of aligners with respect to MQSs. (a) and (c) give the cumulative number of correctly mapped reads and incorrectly mapped reads from high to low mapping quality. (b) and (d) show the cumulative accuracy and error fractions from high to low mapping quality. (a) and (b) use the indel data set included in Table 4, and (c) and (d) use the Mason data set included in Table 5. Each point in each plot corresponds to an MQS given by an aligner. Subread was run with default setting in (a) and (b) and with -f 100 in (c) and (d).

