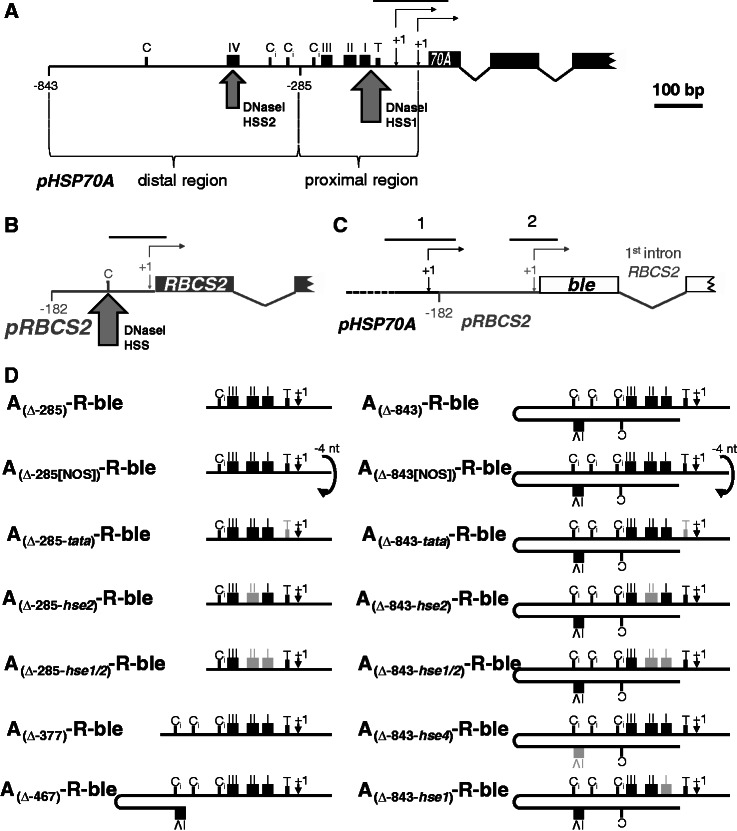
Figure 1.
Regions amplified from chromatin immunoprecipitates by qPCR and HSP70A promoter mutation/deletion constructs used in this study. Schematic drawings of the native HSP70A gene (black) (A), the native RBCS2 gene (grey) (B) and the ble transgene (white) driven by the HSP70A–RBCS2 tandem promoter (C). Non-coding regions are drawn as thin lines, coding regions as boxes. Thin-lined arrows indicate transcriptional start sites (+1), of which the HSP70A promoter has two (32). RBCS2 promoter deletion end points are given relative to the transcriptional start site. Large arrows mark the positions of DNaseI hypersensitive sites (HSS) as detected previously (33). Sequence motifs highlighted are CCAAT-boxes (C), inverted CCAAT-boxes (Ci), HSEs (black boxes with roman numbers) and a TATA-box (T, small black box). Black lines on top of the promoters designate the regions amplified by qPCR. (D) Overview of HSP70A promoter variants fused upstream of the RBSC2 promoter. HSP70A (A) promoter sequences are situated with optimal spacing upstream of the RBCS2 (R) promoter in all constructs except for those designated NOS (non-optimal spacing), which contain a 4-bp deletion (in lower case) in the GCTAGCttaaGAT NheI–AflII linker between both promoters (31). HSP70A promoter deletion end points are given relative to the translational start codon. The transcriptional start site indicated (+1) is that of promoter PA1 situated 89-bp upstream of the translational start codon (32). Light grey boxes designate mutated motifs with nucleotide substitutions as described earlier (34).

