
Figure 2.
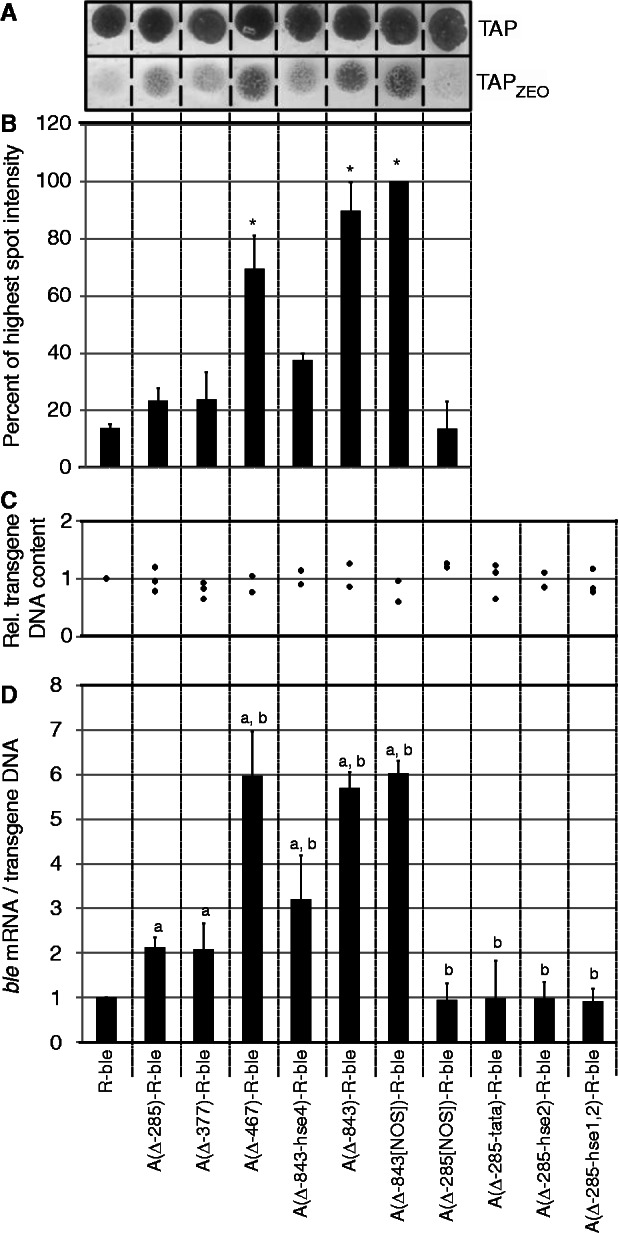
Mutation/deletion of HSEs or TATA-box in the HSP70A promoter impairs its activating effect on R-ble transgene expression. (A) Spot test to determine the fraction of zeocin-resistant co-transformants. Pools of at least 200 co-transformants generated with the constructs indicated were grown in TAP medium and spotted on TAP–agar plates lacking zeocin (TAP) or supplemented with 1.5 µg/ml of the drug (TAPzeo). (B) Quantification of survival rates. Spots on zeocin-containing TAP agar plates were quantified by densitometry. Shown are averages and SEM (n = 2–3). Asterisks indicate the significance as determined by the All Pairwise Multiple Comparison Procedure (Fisher LSD Method) after successful ANOVA (P < 0.001). (C) Relative content of transgenic DNA in co-transformant pools. Relative copy numbers of transgenic constructs were determined by qPCR on extracted total DNA. Each diamond represents an independent experiment analyzed in triplicate. (D) Accumulation of ble mRNA relative to transgenic DNA in co-transformant pools. ble mRNA levels were quantified relative to those of CBLP2 by qRT–PCR, first normalized by the transgenic DNA content determined in (C), and subsequently to the normalized value determined for the co-transformant pool generated with R-ble. Error bars represent standard errors of two to three biological replicates, each analyzed in triplicate. Letters indicate the significance as determined by the Fisher LSD Method after successful ANOVA (P < 0.001). a, significant difference to R-ble; b, significant difference to A(Δ285)-R-ble.