
Figure 1.
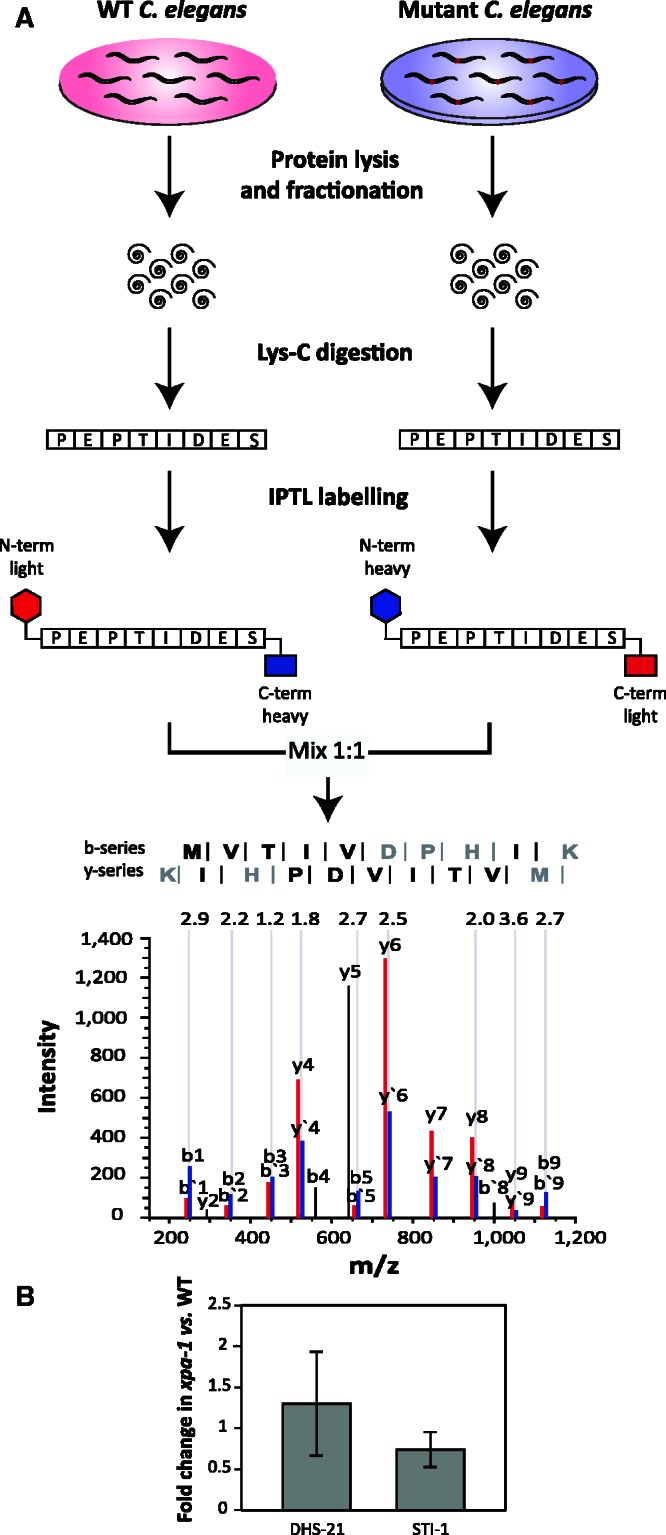
Comparative quantitative proteomics by IPTL. (A) Experimental design. C. elegans N2 and xpa-1 Lys-C resulting peptides were crosswise labeled using the IPTL technique, and combined 1:1 before submission to LC-MS/MS. As an example, N-terminal light/C-terminal heavy (red) and N-terminal heavy/C-terminal light (blue) pairs (10 ratio counts input) from the mass spectrum of a selected peptide identified as MVTIVDPHIK (inset with the detected y and b series ions represented), present in the protein F40F9.6, 2.3-fold up-regulated. (B) Quantitative analysis of DHS-21 and STI-1 protein levels by western blotting. Protein levels were normalized to alpha actin and presented as average fold changes ± SD from four independent replicates.