Figure 2.
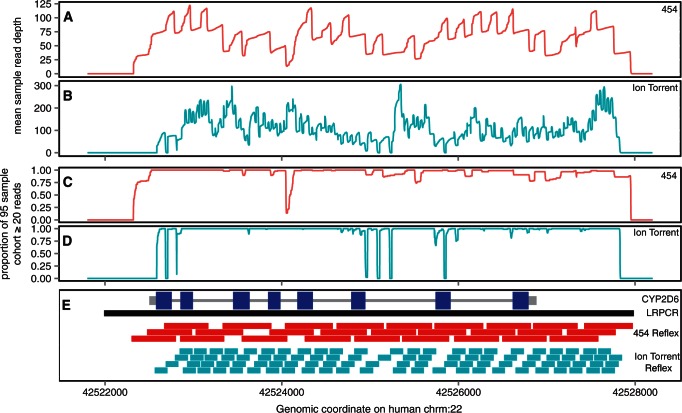
Target coverage and Reflex primer design. (A and B) The mean sample read depth for each base position on the x-axis for 454 and Ion Torrent platforms, respectively. (C and D) The proportion of the 95 sample cohort sequenced to at least 20 reads for each base position on the x-axis for both NGS platforms. Amplicon designs (E) with CYP2D6 UTRs are shown thick grey bars, introns as thin grey bars and exons as thicker blue bars. LRPCR amplicon is shown as black, with 454 and Ion Torrent Reflex amplicons shown in red and turquoise, respectively.

