Figure 4.
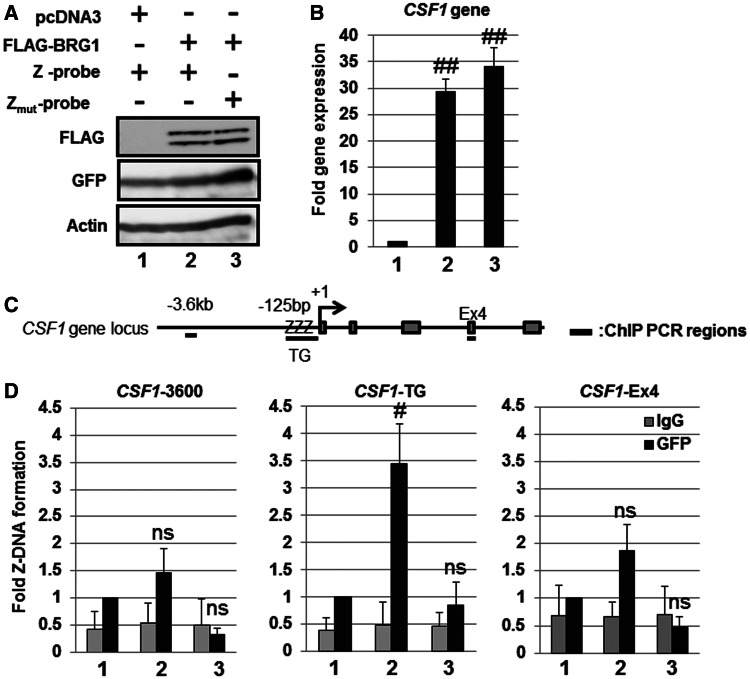
Detection of BRG1-dependent Z-DNA formation in the human CSF1 promoter using the Z-probe. (A) SW13 cells were transfected with the Z-probe or Zmut-probe together with the BRG1 expression vector as indicated in the figure. Whole-cell lysates were separated using SDS–PAGE, and the protein expression was analyzed through immunoblotting using specific antibodies as indicated in the figure. (B) SW13 cells were transfected with BRG1 together with the Z-probe (lanes 1 and 2) or Zmut-probe (lane 3) expression vectors, and the CSF1 gene expression was analyzed using real-time PCR. The value of lane 1 was arbitrarily set as 1, and the relative expression levels were expressed as the means ± SEM of four independent assays. (C) A schematic figure of the human CSF1 gene locus and regions detected using ChIP analysis. +1: transcription start site; ZZZ: CSF1-TG repeat region; Ex4: CSF1 Exon 4 region. (D) The SW13 cells were transfected with the Z-probe or Zmut-probe together with BRG1 expression vectors, and subsequently, a ChIP assay was performed using an anti-GFP antibody (black bars). Normal rabbit IgG was used as a negative control (gray bars). Fold Z-DNA formation was measured using real-time PCR with specific primer sets for the upstream region of the CSF1 promoter (CSF1-3600), the CSF1-TG or CSF1-Ex4 regions. The anti-GFP ChIP value in lane 1 is set as 1, and the relative binding values are expressed as the means ± SEM of four independent assays. #P < 0.05 and ##P < 0.01 compared with the value of lane 1 (Dunnett’s test for multiple parameter comparisons); ns: no significant difference. The lane numbers correspond to the cells transfected in (A).

