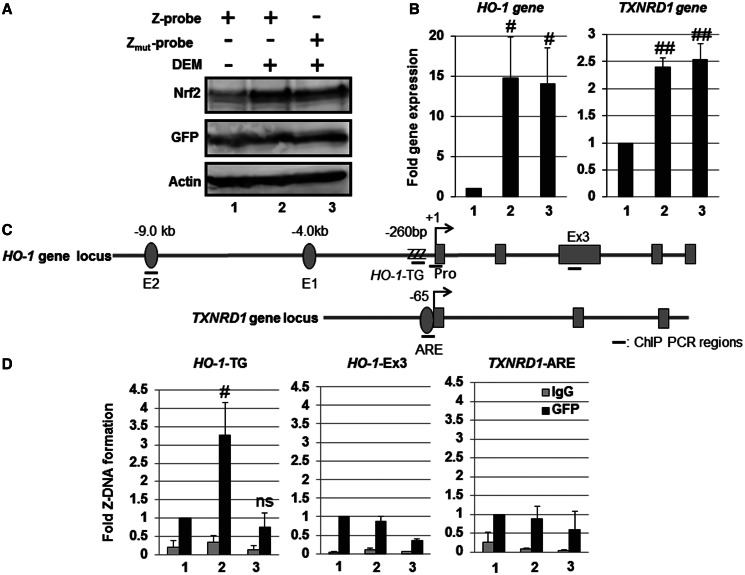
Figure 5.
Human HO-1 gene promoter adopts a Z-DNA form in response to Nrf2-activating agent DEM. HeLa cells were transfected with the Z-probe (lanes 1 and 2) or Zmut-probe (lane 3) expression vectors. At 24 h after transfection, the cells were untreated (lane 1) or treated with 100 µM DEM for 3 h (lanes 2 and 3). (A) Whole-cell lysates were separated using SDS–PAGE, and the protein expression was analyzed through immunoblotting using specific antibodies, as indicated in the figure. (B) The gene expression was analyzed through real-time PCR using primers specific for the HO-1 and TXNRD1 genes. The value of lane 1 is set as 1, and the relative expression values are expressed as the means ± SEM of five independent assays. (C) A schematic figure of the human HO-1 and TXNRD1 gene loci and regions as detected through ChIP analysis. E2: E2 enhancer; E1: E1 enhancer; +1: transcription start site; ZZZ: HO-1-TG repeat region; Pro: HO-1 gene promoter region; Ex3: HO-1 Exon 3 region; TXNRD1-ARE: TXNRD1 ARE region. (D) HeLa cells were transfected with the Z-probe or Zmut-probe, and subsequently, the cells were exposed to 100 µM DEM for 3 h. After DEM treatment, a ChIP assay was performed using an anti-GFP antibody (black bars). Normal rabbit IgG was used as a negative control (gray bars). The amount of precipitated DNA was measured through real-time PCR using specific primer sets for the HO-1-TG, HO-1-Ex3 and TXNRD1 ARE regions. The anti-GFP ChIP value of lane 1 is set as 1, and the relative bindings are expressed as the means ± SEM of five independent assays. #P < 0.05 and ##P < 0.01 compared with the value of lane 1 (Dunnett’s test for multiple parameter comparisons); ns: no significant difference. The lane numbers correspond with the treatments in (A).

