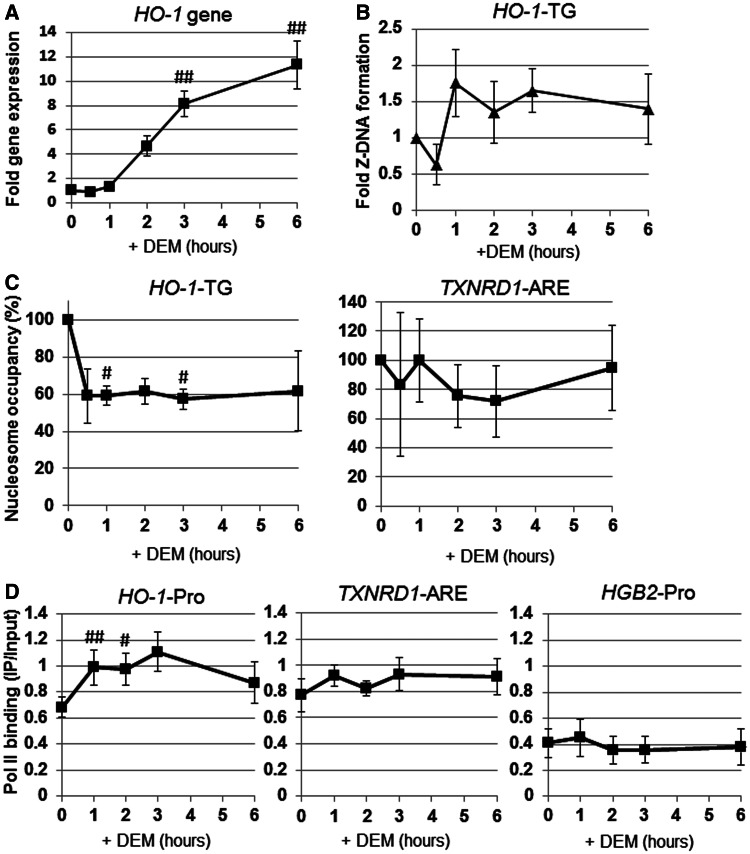
Figure 6.
Dynamics of Z-DNA formation, Pol II recruitment and nucleosome occupancy on the HO-1 regulatory region in response to DEM. HeLa cells were transfected with the Z-probe expression vector, and at 24 h after transfection, the cells were exposed to 100 µM DEM for various amounts of time as indicated. (A) HO-1 gene expression was analyzed through real-time PCR using an HO-1-specific primer set. (B–D) The ChIP assays were performed using anti-GFP, anti-Pol II and anti-H3 antibodies. Z-DNA formation was measured through real-time PCR using a specific primer set for the HO-1 TG repeat region (HO-1-TG; B). Nucleosome occupancy was measured through real-time PCR using specific primer sets for the HO-1 TG repeat (HO-1-TG) and the TXNRD1 ARE (TXNRD1-ARE) regions (C). The value (%) at 0 h is set as 100, and the relative changes are expressed as the means ± SEM of three independent assays. Pol II recruitment was measured through real-time PCR using specific primer sets for the HO-1 gene promoter (HO-1-Pro), TXNRD1 gene in the ARE region (TXNRD1-ARE) and γ-globin promoter region (HGB2-Pro) (D). The values are shown in IP/input, and the relative changes are expressed as the means ± SEM of three independent assays. #P < 0.05 and ##P < 0.01 compared with the value at 0 h (Dunnett’s test for multiple parameter comparisons).

