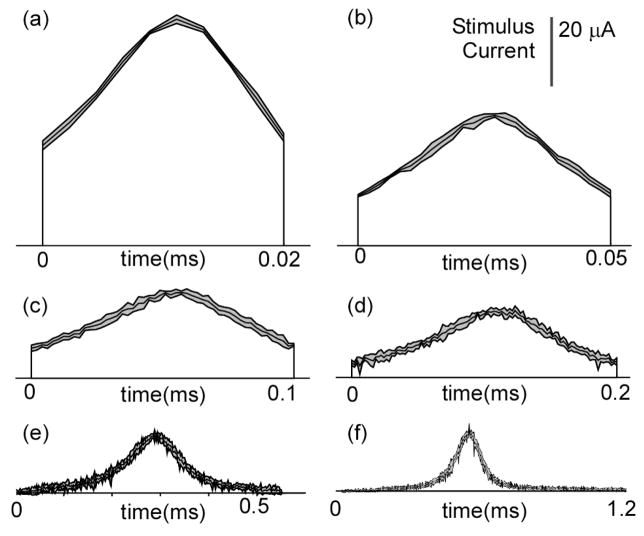
Fig. 1.
Energy-optimal stimulation waveforms determined with a genetic algorithm for different PWs: 0.02, 0.05, 0.1, 0.2, and 0.5 ms (a–e, respectively). f) Waveforms for PW = 1 and 2 ms combined. For PW ≥ 0.5 ms, the peaks of the waveforms were aligned and leading/trailing tails of low amplitude were excluded for plotting. Curves within the gray regions represent the means of the resulting waveforms across 5 trials, and the upper and lower curves define 95% confidence intervals.

