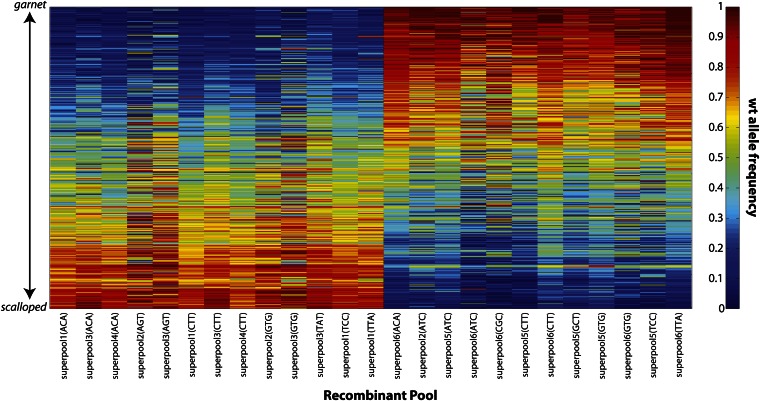
Figure 2.
Heat map depicting the frequency of the wild-type (wt) parental allele at each of 451 SNPs for each of the 25 pools of 100 recombinant males included in the final analysis. Each column represents a pool, with the top of the plot representing the 5′ end of the g-sd region and the bottom representing the 3′ end. Note that the expectation is that allele frequencies should start at 0 (blue) and increase to 1 (red) from top to bottom or vice versa, depending on the recombinant phenotype class comprising the pool. The pools are ordered such that all of the g+ pools are presented first followed by the +sd pools. Within each phenotype class, the ordering of pools is arbitrary. Within each phenotype class each pool is labeled by its superpool identification number (1–6) and barcode.

