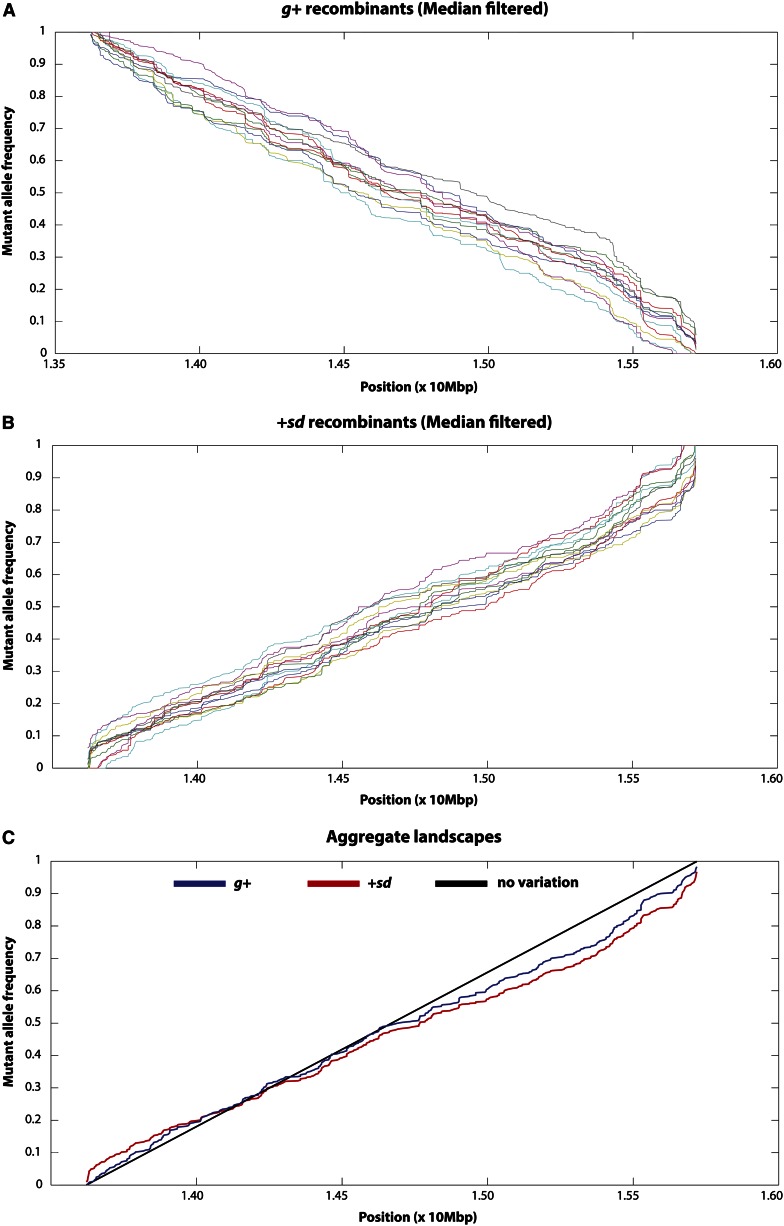
Figure 3.
Median-filtered allele frequency landscape of the frequency of the g-sd parental allele as a function of physical position for each of the pools surviving our stringent filtering criteria for (A) the 12 g+ pools and (B) the 13 +sd pools. The aggregate landscapes (averaged across pools within recombinant phenotype classes) are depicted in C. In this aggregate landscape plot, the black line depicts uniform distribution of crossover events across this interval. The aggregate landscape for the +sd recombinant individuals is plotted in red, and the aggregate landscape for the g+ recombinant individuals is plotted in blue. Note that this latter landscape has been reflected for ease of comparing the allele frequency landscapes between the two recombinant phenotype classes.

