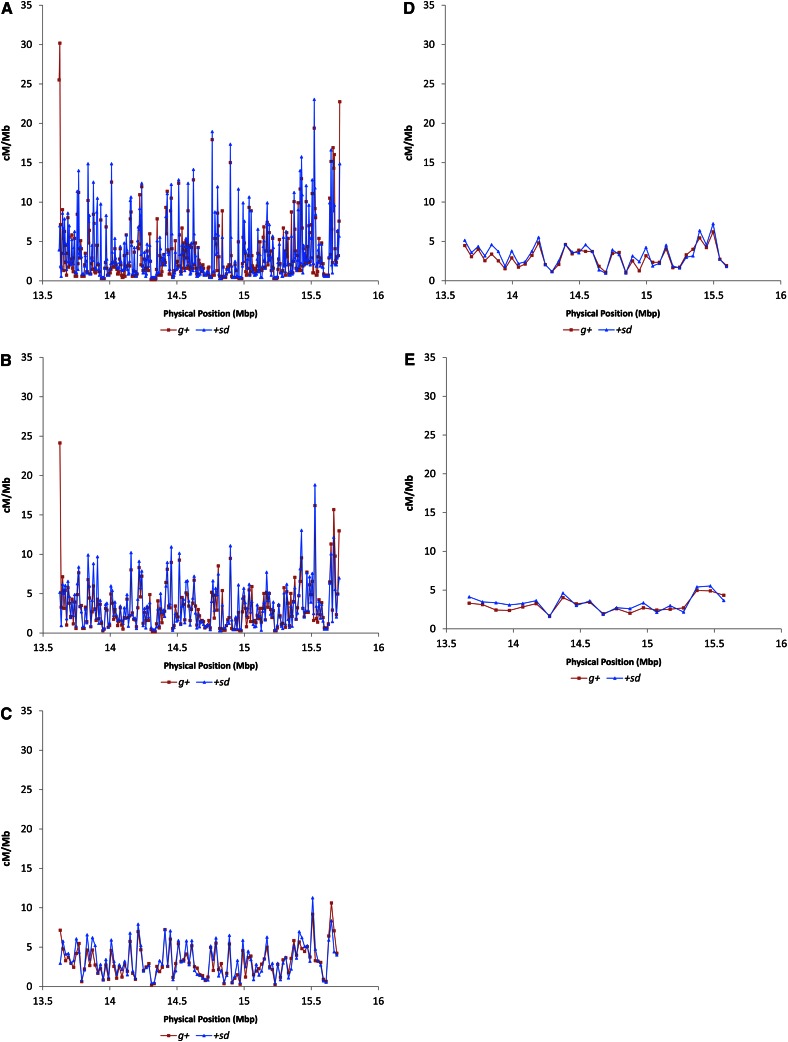
Figure 5.
Crossover rate (cM/Mbp) as a function of physical position estimated in nonoverlapping windows of (A) 5 kb, (B) 10 kb, (C) 20 kb, (D) 50 kb, and (E) 100 kb. The two recombinant phenotype classes are presented separately, with the recombinational landscape derived from g+ flies presented in red and the landscape derived from the +sd flies in blue.

