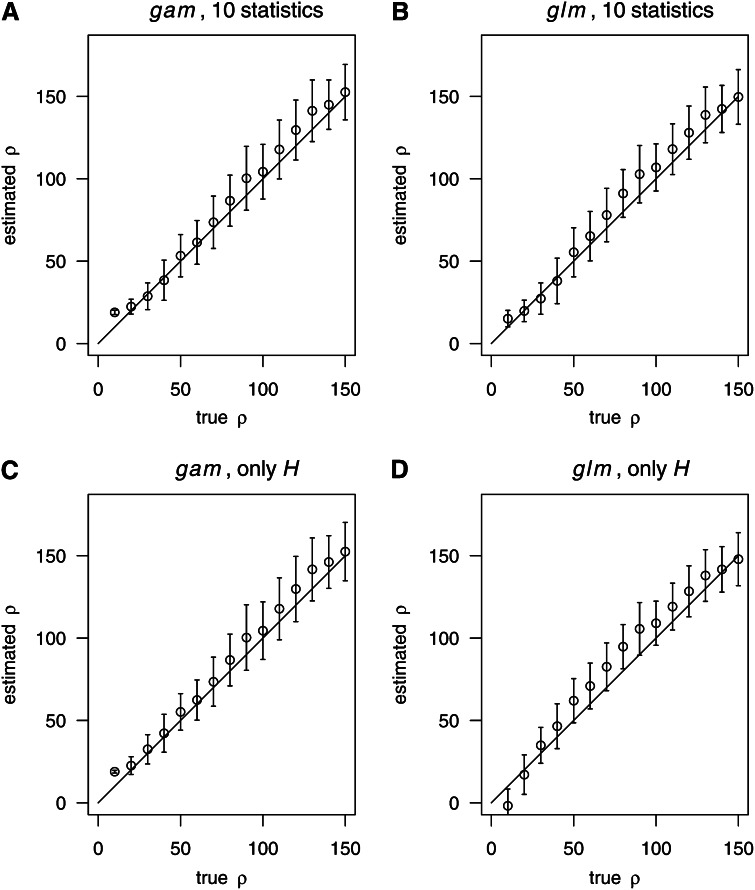
Figure 1.
Estimating ρ based on two different strategies for boosting. In each part (A–D), we provide averages and standard deviation bars to illustrate both bias and random errors of the estimates of ρ. A grid of true values of ρ is displayed on the x-axis. The solid line showed where estimated ρ equals real ρ. We considered the following two strategies for boosting: “10 statistics,” 10 summary statistics (Table 2) were used to represent the data. “Only H”: only the number of different haplotypes was used to represent the data. Simulation parameters: n = 200, S = 59. For training, we used ρ = 20, 60, 100, 140, and 180. For each true value of ρ, 100 samples (independent from the training samples) were used for testing.

