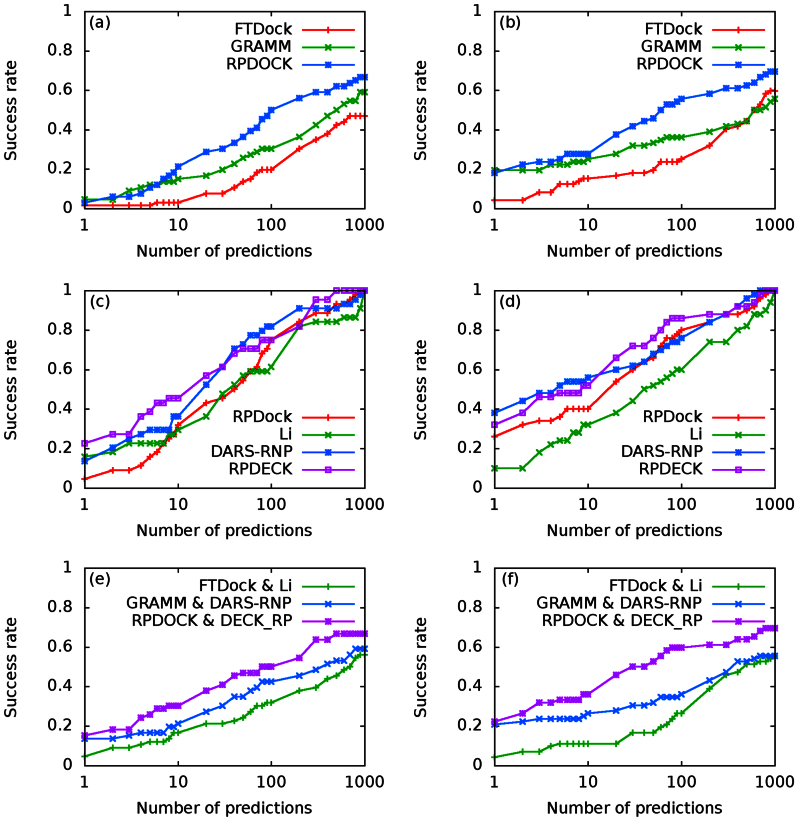
Figure 2. Success rate comparisons over Testing Set I (a, c, e) and Testing Set II (b, d, f).
(a) and (b) are docking success rates of FTDock, GRAMM and RPDOCK. (c) and (d) are scoring success rates over RPDOCK decoys. Li, DARS-RNP and DECK-RP are compared. For each case, top 1000 structures are generated by RPDOCK and are evaluated by corresponding scoring functions. The ranking result directly by RPDOCK is also shown as a reference. (e) and (f) are protocol success rates of FTDock&Li, GRAMM&DARS-RNP and RPDOCK&DECK_RP. For each case, top 1000 structures are generated by the corresponding docking procedures and are evaluated by the scoring functions.

