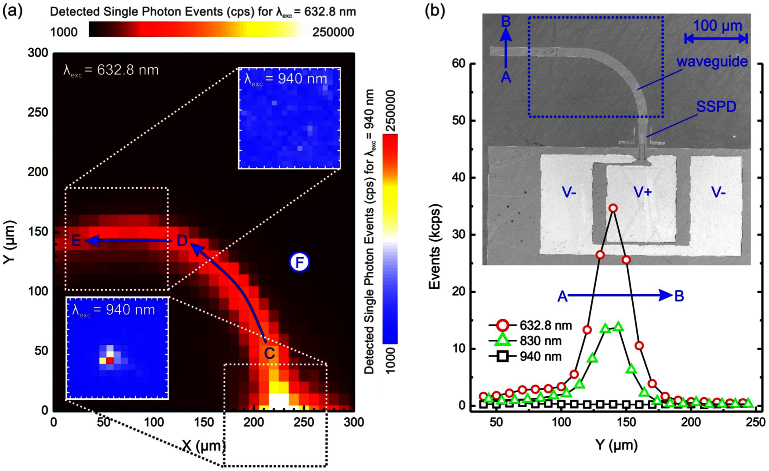
Figure 2.
(a) Detected single photon events as a function of the laser position along the waveguide for λexc = 632.8 nm, as shown in red color code. The two insets given with blue color code each correspond to a (100 μm)2 area illuminated with λexc = 940 nm. For illumination at the end of the waveguide only background light is detected, whereas a strong peak is observed at the position of the SSPD. (b) Recorded single photon events for line scans along the A-B marked line with different excitation wavelengths. The waveguide can clearly be identified for 632.8 nm and 830 nm, whereas only a small background is detected for 940 nm. The inset shows an SEM image of the analyzed structure with the scan area of figure 2a marked by a dotted line.

