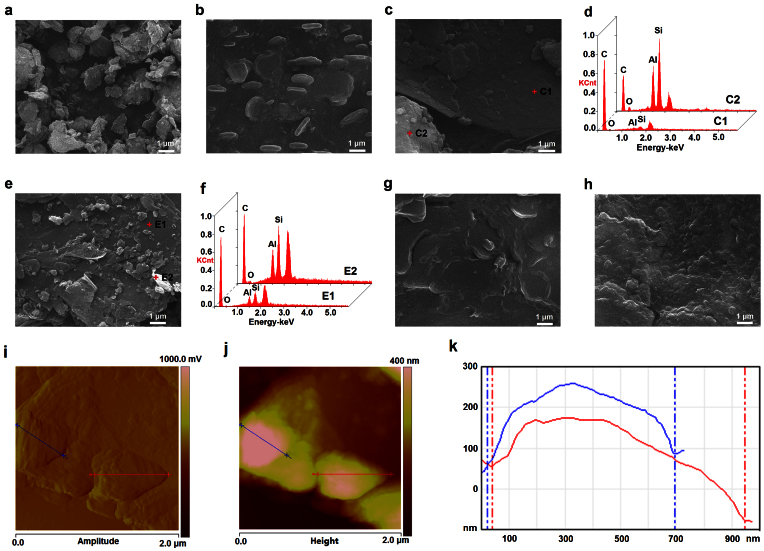
Figure 2. Morphologies of the samples.
SEM images of the (a) B, (b) SA/B, (c) GB, and the corresponding EDS patterns (d), (e) GBm and the corresponding EDS patterns (f), (g) SA/GB and (h) SA/GBm. Tapping-mode AFM image of the SA/GBm, (i) the amplitude image and (j) the corresponding height image and (k) the cross section analysis along the line.

