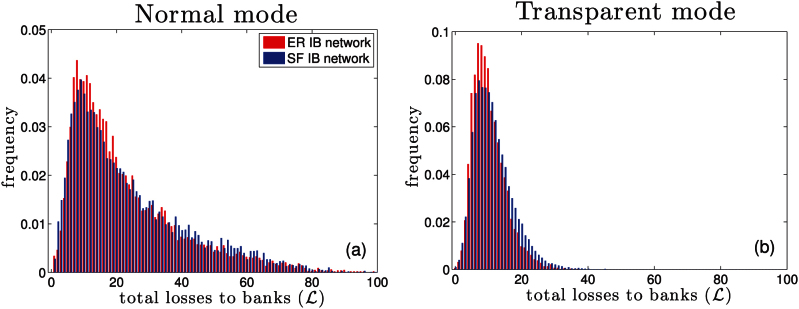
Figure 5. Distributions of losses  for the normal (a) and transparent mode (b), for an ER (red) and a SF network (blue), both with the same average connectivity 〈k〉 = 11.5.

