
Figure 6.
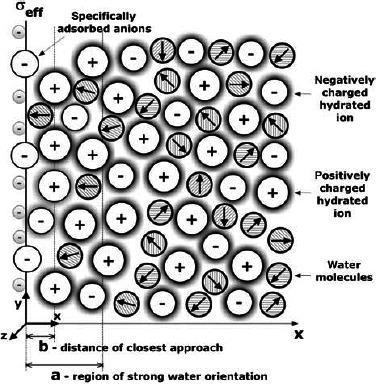
Charge distribution SLB model (Gongadze et al. 2011c), where in the interval 0 < x < a is the region of strong water orientation and b is the distance of closest approach. The surface charge density σ = σeff incorporates the negatively charged metallic surface, as well as the specifically bound negatively charged ions (Butt et al. 2003).