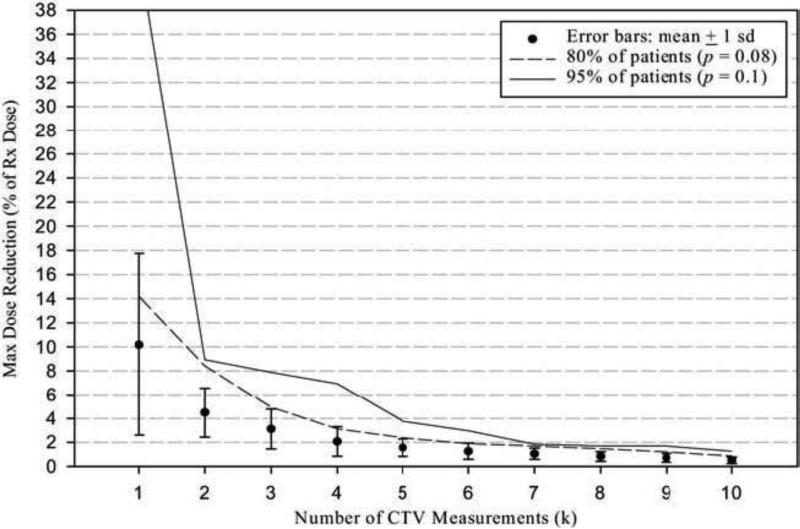
Figure 2.
Error bar indicates the mean and 1 standard deviation of maximum dose reduction for a given number of computed tomography measurements. The maximum dose reduction (% of Rx. dose) in the clinical target volume due to internal target motion when the patient specific target was applied was estimated considering the worst situation.

