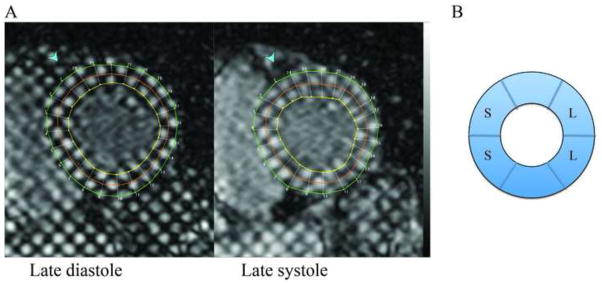
Figure 1. Cardiac magnetic resonance tagging and LV segmentation.

A: shows 2 tagged cardiac magnetic resonance images with a short axis view of the left ventricle, one late diastolic and one late systolic image, with the grid from the HARP analysis software over the left ventricular myocardium. B: shows the segmentation of the mid-ventricular short-axis slice used for strain analysis. Segments labeled with “S” denote the septal segments and segments labeled “L” denote the lateral wall segments.
