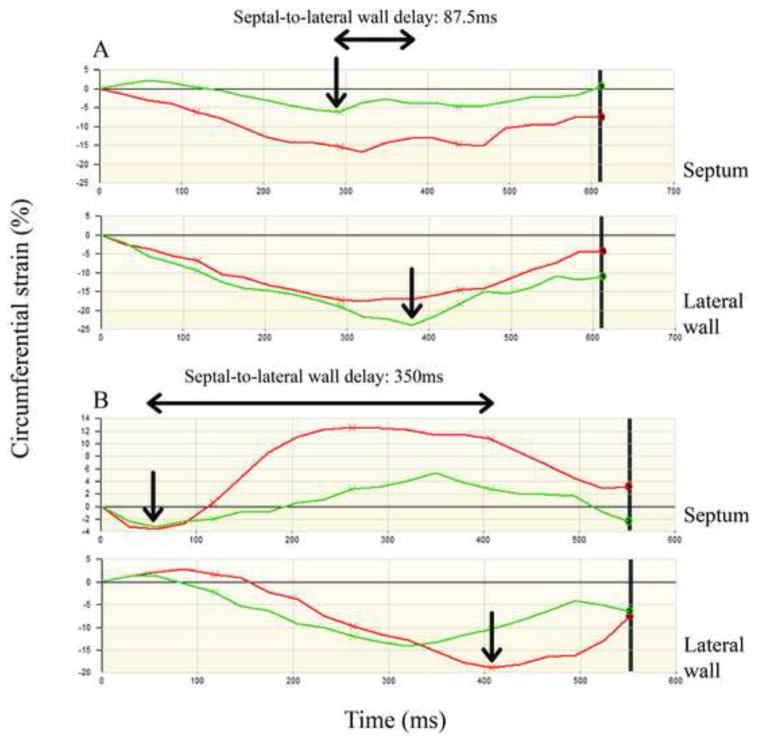
Figure 2. Cardiac magnetic resonance tagging strain curves.
Strain curves for 2 patients (patient A and patient B). For each patient, the strain curves for 2 septal segments and 2 lateral wall segments are presented in red and green. In each patient, the peak circumferential strain in the septal segment with the earliest peak and the peak circumferential strain in the lateral wall segment with the latest peak are denoted with arrows. Peak circumferential strain is defined as the first negative peak followed by an upward slope of more than 3% of the circumferential strain that continued positively for more than one time frame. Patient A has a septal-to-lateral wall delay of 87.5 ms and patient B has a septal-to-lateral wall delay of 350 ms. Note also that the differences in septal contraction pattern between the two patients. Patient A has a normal and relatively undisturbed septal contraction. However, for patient B, the septal peak strain – peak of contraction – was early with an amplitude of −4% (marked with an arrow for the red strain curve) followed by positive strain (stretching) in the septum.

