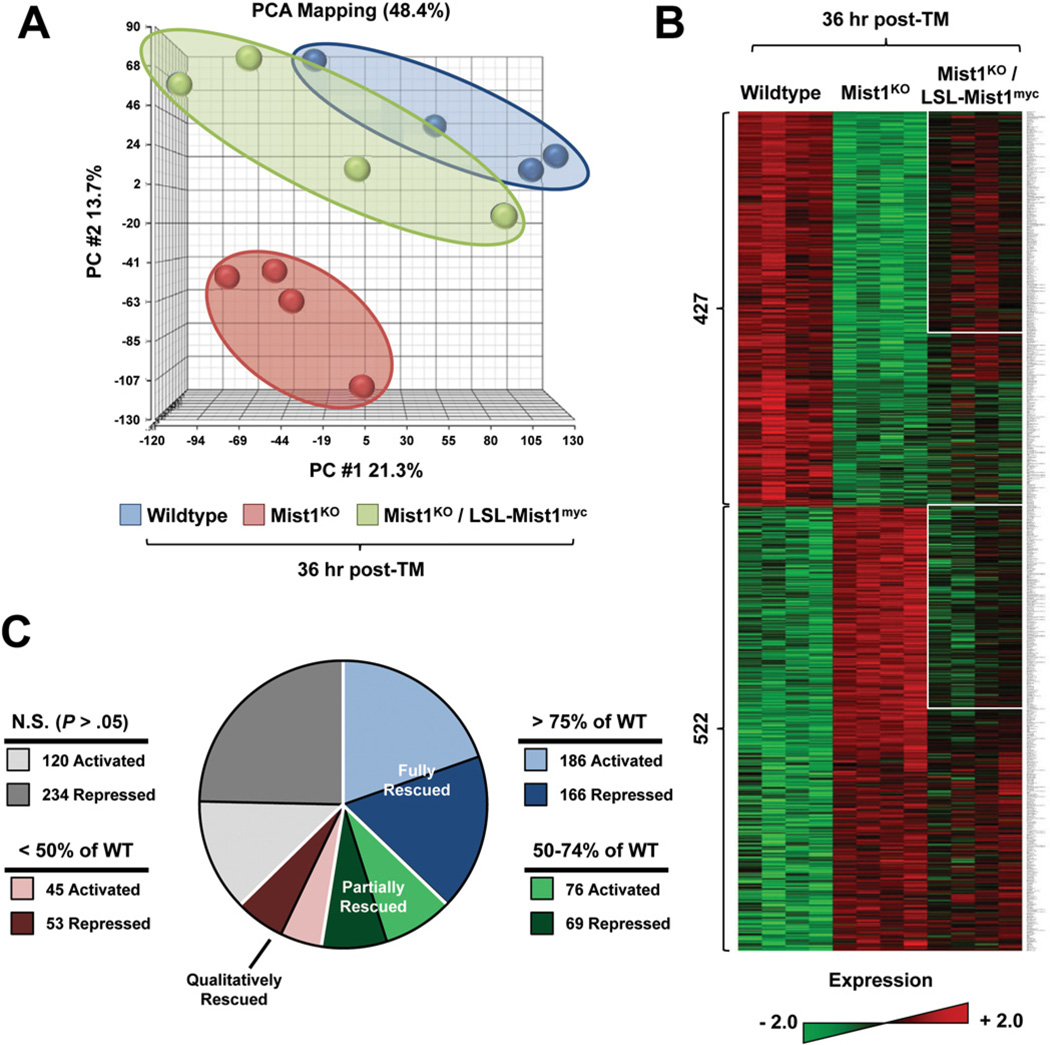
Figure 2.
Expression of LSL-Mist1myc for 36 hours induces extensive changes in gene expression. (A) Principle component analysis (PCA) of WT, Mist1KO, and Mist1KO/LSLMist1myc mice after TM. Each small circle represents an individual animal. See the Supplementary Materials and Methods section for details. (B) Representative heat map of 4 individual WT, Mist1KO, and Mist1KO/LSL-Mist1myc pancreas RNA samples. The 949 genes that showed a significant difference in expression (P < .05; fold-change, >1.5) between WT and Mist1KO are indicated. White boxes represent fully and partially rescued genes. (C) Pie chart illustrating the degree of recovery for the 949 identified genes in Mist1KO/LSL-Mist1myc mice after TM. See the text for details.

