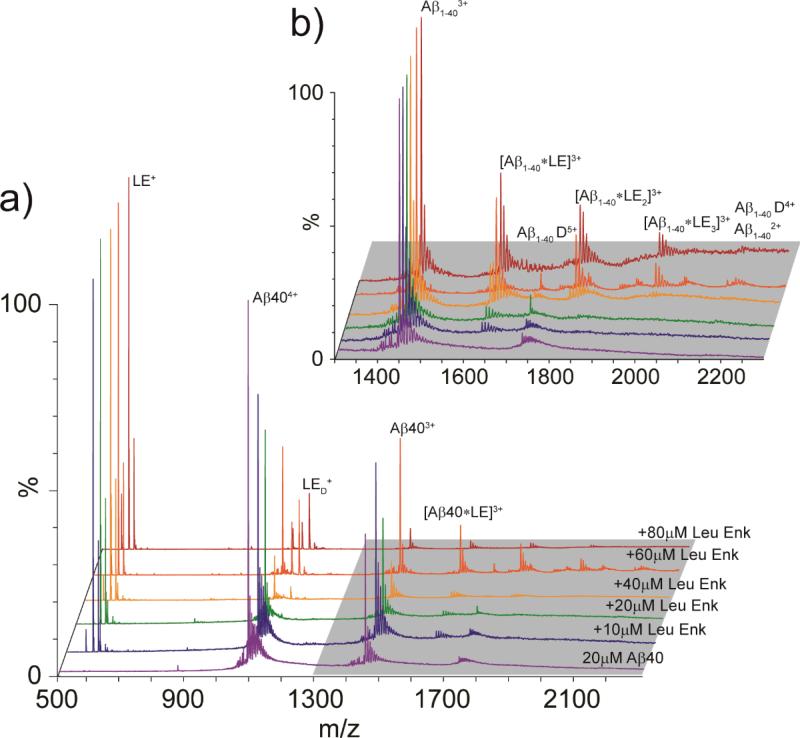
Figure 2.
(A) MS spectra for Aβ1-40 acquired at 20 μM (purple). Aβ1-40 was then incubated with increasing concentrations of LE, ranging from 10-80 μM (stoichiometric ratios from 0.5 to 4). At sufficiently high LE concentrations, Aβ1-40 is seen in complex with LE, producing Aβ:LE complexes ranging from 1:1: to 1:3. (B) A magnified region of the spectrum shown in A (grey highlight), where signals corresponding to Aβ:LE complexes are labeled.

