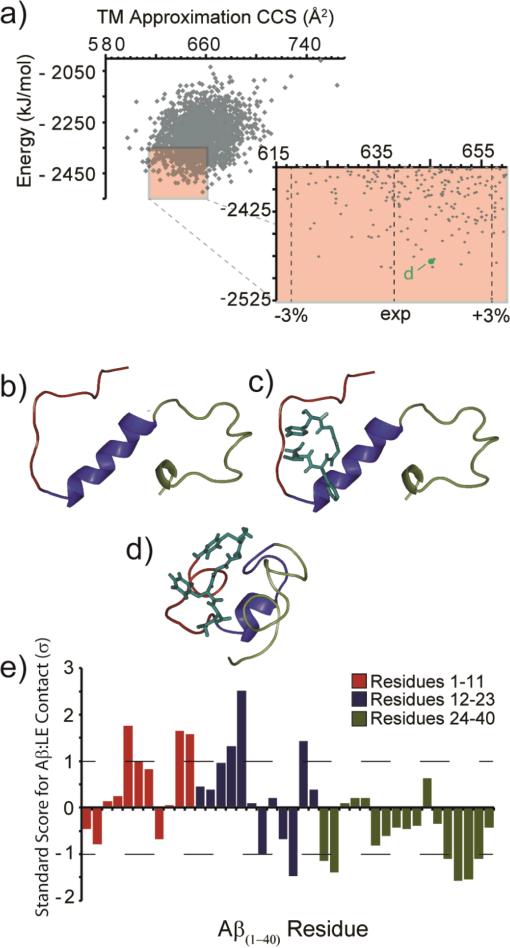
Figure 4.
(A) Output from all molecular dynamics simulations. The lowest energy 201 structures with CCS values within ±3% of experiment are highlighted (red box). (B) The structure of Aβ monomer (PDB 2LFM). (C) A docked structure of Aβ (PDB 2LFM) with LE using AutoDock Vina. (D) A representative low energy model (indicated in A) from the main structural family identified from our MD simulations, in agreement with experimental CCS values. Colors represent the N-terminus (red), core/helix region (blue), and the C-terminus (green). (E) A plot of the standard score (Z-score) for Aβ residues within 4 Å of the bound LE. Larger values denote contacts of greater significance on the standard deviation (σ) scale. Negative values denote contacts of reduced significance.

