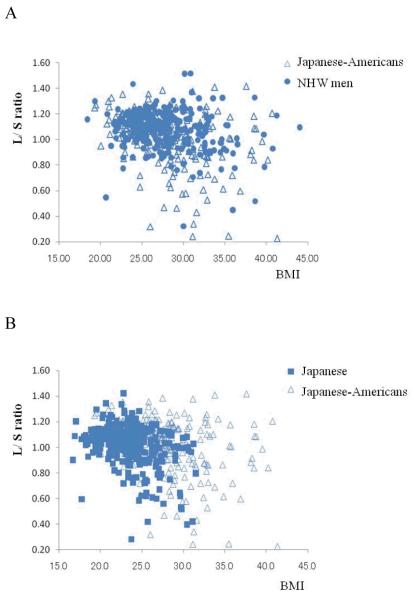
Figure 1.
The raw data were plotted against BMI and liver to spleen ratio (L/S ratio) in Figure 1A and 1B. The data for Japanese-Americans (open triangle) and non-Hispanic white (NHW) men (solid circle), and those for Japanese-Americans and Japanese (solid rectangle), were superimposed each other in Figure 1A and 1B, respectively. In Figure 1C, subjects were stratified by BMI in Japanese-Americans (cross), Japanese men (solid rectangle), and NHW men (solid circle), separately and mean values (±SEM) of BMI for each quartile are plotted against mean values (±SEM) of L/S ratio for respective quartiles. As shown in Figure 1A and 1B, raw data plots for Japanese-Americans were partly overlapped with both those for NHW men (1A) and those for Japanese (1B).

