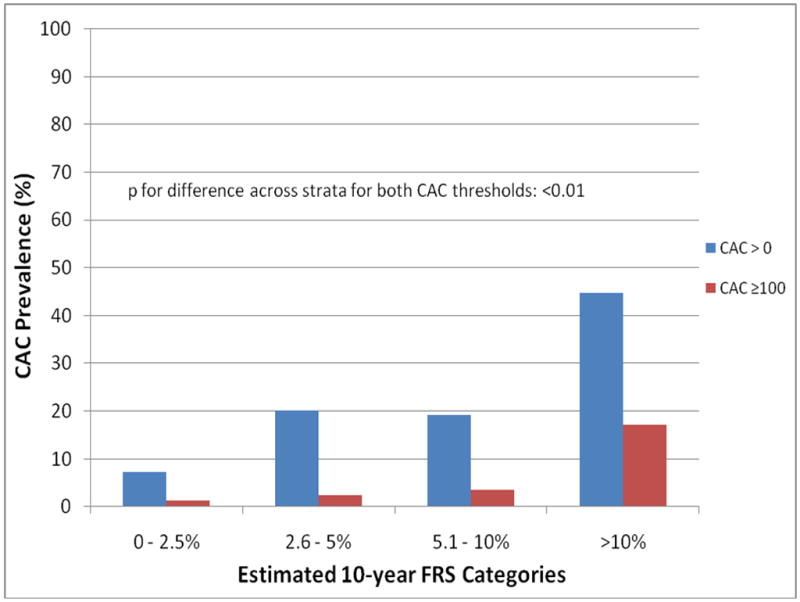
Figure 1. CAC Score Compared With FRS.

Prevalence of coronary artery calcium (CAC) scores >0 and ≥100 compared across 10-year Framingham Risk Score (FRS) strata in the CARDIA study. There was significant concordance between CAC prevalence/amount and FRS such that prevalence of CAC scores >0 and ≥100 were low in the lower FRS strata and increased with higher FRSs.
