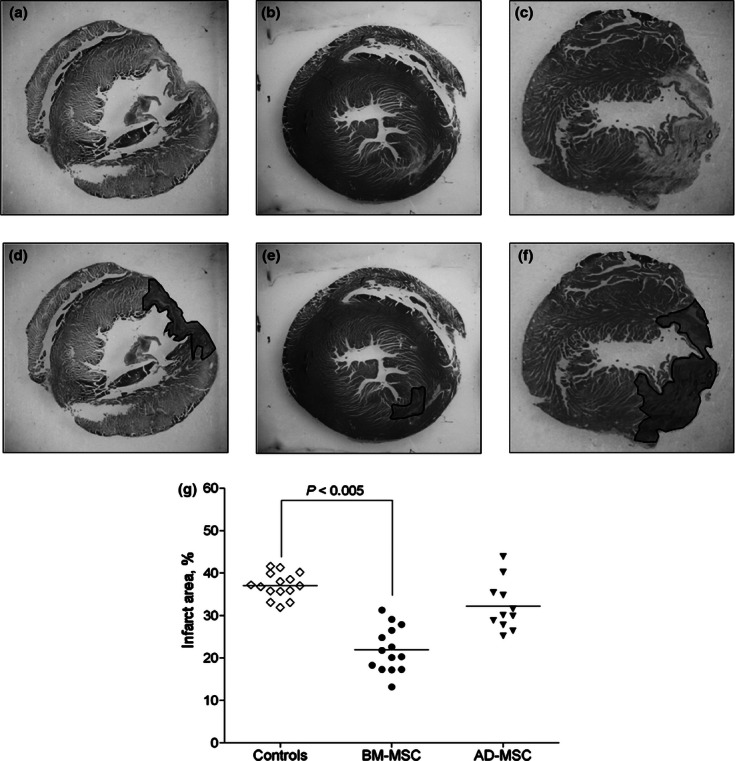
Figure 5.

Representative haematoxylin/eosin-stained cross-sections of the heart from control (a), AD-MSC- and BM-MSC-treated rats ((b) and (c) respectively). (d–f) the infarct area in the respective slides is highlighted. (g) quantitative values of infarct area defined as a percentage infarct scar area relative to the outer circumference of the LV free wall in the above groups. The data are expressed as dot plots with median values. Infarct area was significantly smaller in the BM-MSC group as compared to both controls and AD-MSC group.
