
Figure 3.
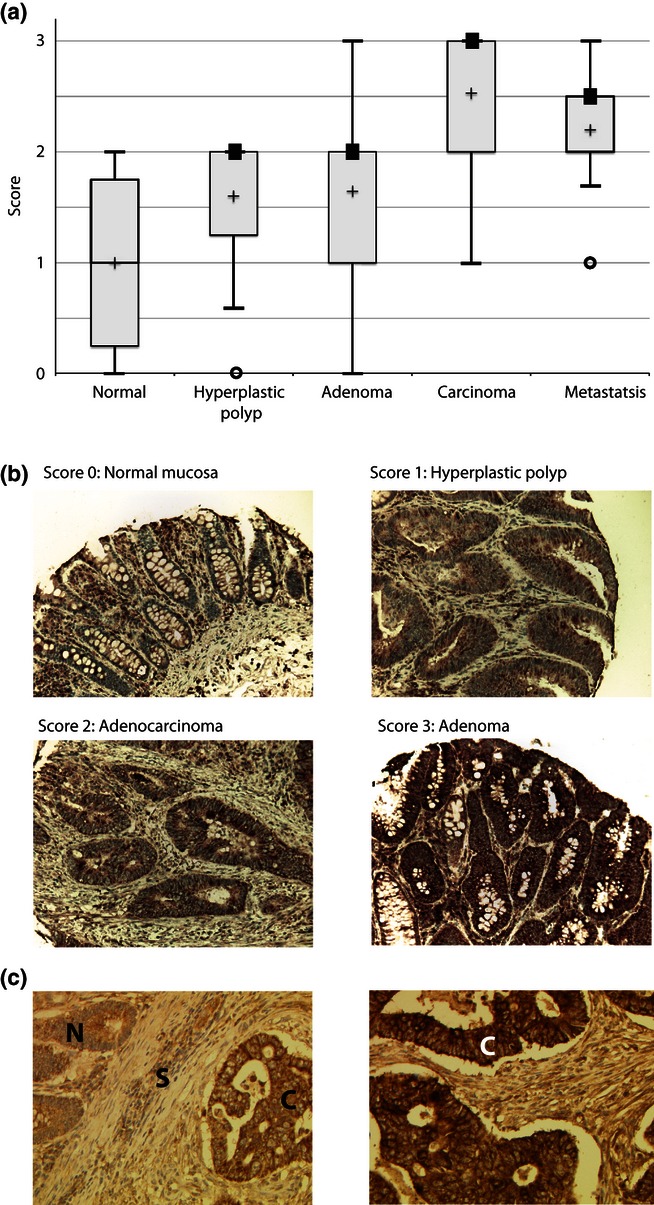
(a) Box plot of IRS2 protein levels assessed on a tissue microarray (TMA) of 64 cases. Solid black boxes indicate the median when this shares the same value as a percentile value. The mean is marked with a cross. All groups differed significantly (chi-squared test, P-value < 0.05). (b) Immunohistochemical analysis of IRS2 protein from representative samples on the TMA demonstrating the four levels of staining. (c) Immunohistochemical analysis of IRS2 protein in colorectal cancer (CRC) cases 026 (left) and 031 (right). N, normal mucosa; S, stroma; C, carcinoma.