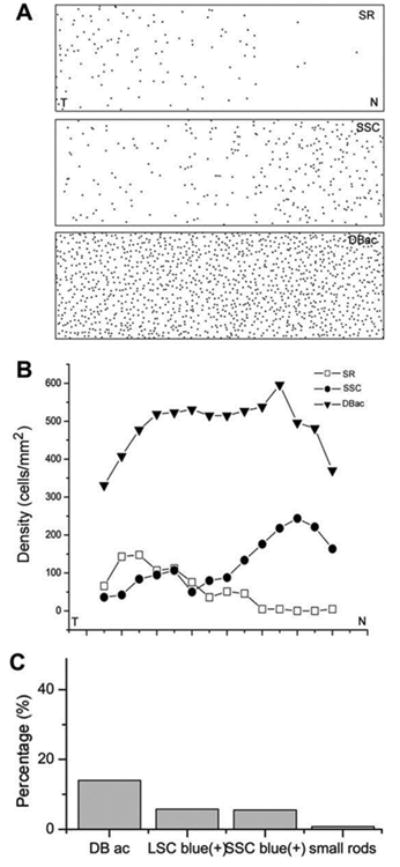
Fig. 6.

(A) The map of small rods (SR), small single cones (SSC), and accessory members of double cones (DBac) across the retina from the nasal to temporal area. (B) The spatial distribution of cell densities of SRs, SSCs and DBac across the retina from the nasal to temporal area. (C) The percentage of different types of S-opsin positive cells in the total number of cones in the salamander retina.
