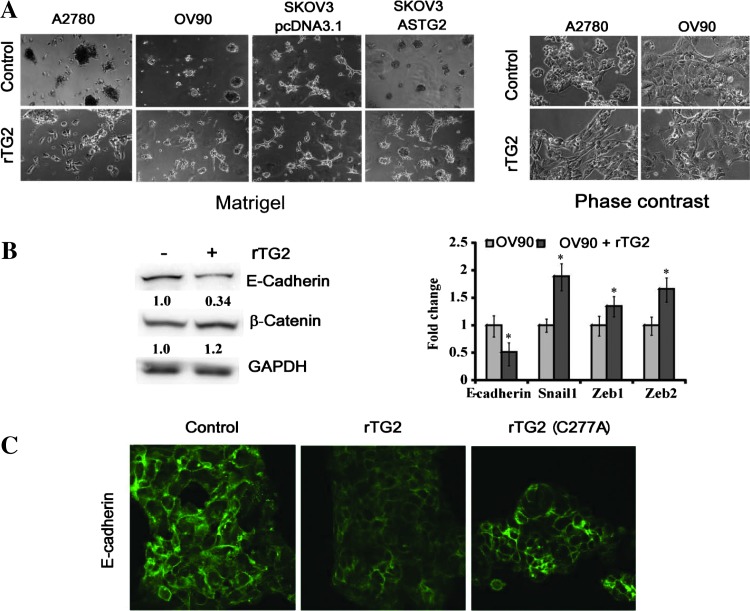
Figure 4.
Extracellular TG2 induces cell invasion and EMT. (A) Cell invasion in Matrigel using 2D cultures with A2780, OV90, and SKOV3/pcDNA3.1 (control) or SKOV3/ASTG2 cells treated with buffer (upper panels, left) or rTG2 (1 µg/ml; lower panels, left) for 72 hours; original magnification, x100. Phase-contrast microscopy demonstrates cell morphology for A2780 and OV90 cells treated with control or with rTG2 (1 µg/ml) for 7 days (original magnification, x200; right panels). (B) Western blot analysis for E-cadherin and β-catenin for control and rTG2 (1 µg/ml)-treated OV90 cells (72-hour treatment; left panel). Densitometry quantifies protein expression relative to GAPDH. qRT-PCR quantifies expression levels for E-cadherin, Snail-1, Zeb-1, and Zeb-2 in OV90 cells treated with control and rTG2 (1 µg/ml) for 72 hours (right panel). Y axis represents fold change in gene expression levels normalized to GAPDH of rTG2-treated OV90 cells compared with control (*P < .05). (C) Immunofluorescence staining for E-cadherin of OV90 cells treated with control, rTG2, or mutant rTG2 (1 µg/ml) for 72 hours (x600).

